
Home / Reports / What causes most car accidents? Federal crash data, 2015-2024
What causes most car accidents? Federal crash data, 2015-2024.
NHTSA's crash-causation survey assigned the critical reason to a driver in 94% of crashes it investigated, mainly recognition errors such as inattention (41%) and decision errors such as driving too fast (33%). NHTSA says that is not a finding of fault. In fatal crashes, an alcohol-impaired driver (29%) and speeding (27%) are the factors recorded most often. Federal figures run through 2024, the latest year available, and are subject to revision.
Free, and no is a fine answer.
- Not a law firm
- You never pay us
- No pressure
- Delete your info anytime
Key findings
- NHTSA assigned the critical reason to a driver in 94% of crashes it investigated (2005-2007 survey, about 2.2 million crashes). Recognition errors were 41% of those, decision errors 33%, performance errors 11%, sleep and other non-performance 7%. NHTSA states the critical reason is not the cause or fault [1].
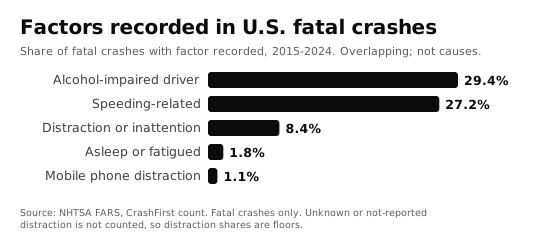
- Alcohol-impaired drivers (BAC 0.08+) were in 29.4% of fatal crashes in 2015-2024; speeding was recorded in 27.2%. In 2024 NHTSA counted 11,904 deaths in alcohol-impaired crashes and 11,288 speeding-related deaths; our counts from the raw files match both exactly [3] [2].
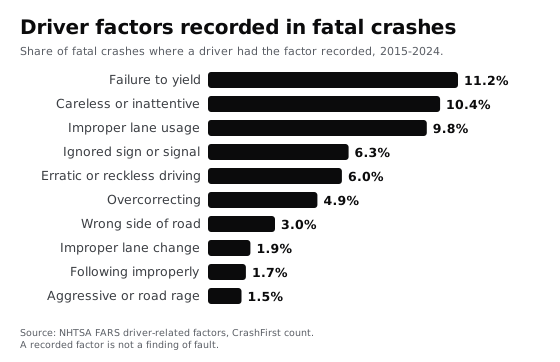
- Next most often recorded among driver factors: failure to yield (11.2% of fatal crashes), careless or inattentive driving (10.4%) and improper lane usage (9.8%). Distraction or inattention was recorded in at least 8.4%, a floor, because the field is unknown or not reported for 66% of 2024 driver records.
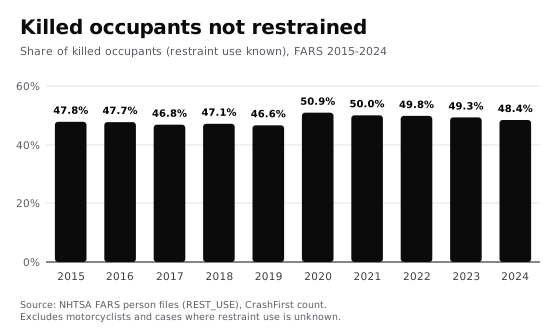
- 48% of killed car, SUV, van and pickup occupants with known belt use were unrestrained in 2024 (47% to 51% every year since 2015). A belt does not cause or prevent a crash; it affects who survives [5].
- A recorded factor is not the cause. Shares overlap, many crashes have several factors, and each describes what police or investigators recorded, not a finding of fault.
- Factors in fatal crashes: totals and 2024 Counts and sharesCSV
- Factors in fatal crashes by yearCSV
- Driver-related factors: totalsCSV
- Driver-related factors by yearCSV
- Killed occupants: restrained or not, by yearCSV
- Vehicle types in fatal crashesCSV
- How often distraction is recorded as unknownCSV
- Fatal crashes and deaths by year (denominators)CSV
Quote with attribution: “CrashFirst Common Causes of Car Accidents, 2026, based on NHTSA FARS and NMVCCS data.”

What does the federal data say causes crashes?
Two federal sources answer different questions. NHTSA's National Motor Vehicle Crash Causation Survey (NMVCCS) investigated a weighted sample of 5,470 crashes on the scene in 2005-2007, an estimated 2,189,000 crashes nationwide [1]. Its "critical reason" was assigned to the driver in 94%, the vehicle in 2%, the environment in 2% and unknown in 2% [1]. NHTSA is explicit about what that is: the critical reason "is not intended to be interpreted as the cause of the crash nor as the assignment of the fault to the driver, vehicle, or environment." [1]
Of the crashes where a driver critical reason was assigned (about 2,046,000):
| Driver critical reason | Share | Examples named by NHTSA |
|---|---|---|
| Recognition error | 41% | inattention, internal and external distractions, inadequate surveillance |
| Decision error | 33% | driving too fast for conditions, false assumption of others' actions, illegal maneuver, misjudging a gap or another's speed |
| Performance error | 11% | overcompensation, poor directional control |
| Non-performance error | 7% | sleep was the most common |
| Other | 8% |
The table above is the survey's Table 2 of driver-related critical reasons [1]. The survey is older (2005-2007) and covers light-vehicle crashes. The second source, the Fatality Analysis Reporting System (FARS), is current but covers only crashes in which someone died [6].
Factors recorded in fatal crashes, 2015-2024
We counted, for every U.S. fatal crash from 2015 to 2024 (358,460 crashes, 389,190 deaths), whether a factor was recorded. A share of fatal crashes where a factor was recorded is not the share caused by it. A crash can carry several factors, and recording one is not a finding of fault.
| Factor recorded | Fatal crashes 2015-2024 | Share | Share in 2024 |
|---|---|---|---|
| Alcohol-impaired driver (BAC 0.08+) | 105,408 | 29.4% | 29.8% |
| Speeding-related (a driver speeding, racing or too fast for conditions) | 97,503 | 27.2% | 28.1% |
| Driver reported impaired by alcohol, drugs or medication | 58,300 | 16.3% | 14.8% |
| Distraction or inattention recorded | 30,086 | 8.4% | 8.1% |
| Driver asleep or fatigued | 6,543 | 1.8% | 1.6% |
| Mobile phone distraction recorded (talking, manipulating or other) | 3,971 | 1.1% | 1.1% |
Alcohol
NHTSA says "About 30% of all traffic crash fatalities in the United States involve drunk drivers (with BACs of .08 g/dL or higher). In 2024, there were 11,904 people killed in these preventable crashes." [3] Not every driver is tested, so NHTSA's files include 10 estimated values of the highest driver BAC in each crash (the MIDRVACC table). We counted the share of those estimates at 0.08 or higher and averaged them; the crash counts are therefore estimates, rounded. Applied to 2024 deaths, the method gives 11,904, the same as NHTSA's figure [7].
Speeding
We count a crash as speeding-related when any driver's speed-related field says racing, exceeded the speed limit, too fast for conditions or speeding with specifics unknown. For 2024 the people killed in those crashes number 11,288, the same as NHTSA's published speeding-related deaths [2] [7].
Distraction
NHTSA describes distracted driving as "any activity that diverts attention from driving" [4]. It reports 3,208 deaths in 2024 in crashes involving distracted drivers; we get 3,207 by counting named distractions plus unspecified distraction and inattention codes [4]. Treat our share as a floor. The 2024 distraction field is "Not Reported" or "Reported as Unknown" for 66.1% of driver records, up from 23.8% in 2015, so year-to-year changes in recorded distraction partly reflect how often it is recorded. The coverage table is in the CSVs.
Seat belts
A seat belt does not cause or prevent a crash; it changes who survives one. Among occupants of cars, SUVs, vans and pickups who were killed and whose restraint use is known, 48.4% in 2024 were unrestrained (9,780 of 20,190); every year from 2015 to 2024 the figure was between 46.6% and 50.9%. NHTSA's figure is "Nearly 50% of those killed were not buckled (based on known seat belt use)" among 22,713 passenger vehicle occupants killed in 2024 [5] [7].
Driver-related factors in fatal crashes
FARS also records driver-related factors for each driver. These are the ten we counted, as a share of all fatal crashes in 2015-2024 (a crash counts once per factor):
| Driver-related factor recorded | Fatal crashes | Share |
|---|---|---|
| Failure to yield right of way | 40,092 | 11.2% |
| Careless, inattentive or improper driving | 37,280 | 10.4% |
| Improper lane usage | 35,270 | 9.8% |
| Failure to obey signs, signals or officer | 22,603 | 6.3% |
| Operating erratically, recklessly or negligently | 21,684 | 6.0% |
| Overcorrecting | 17,391 | 4.9% |
| Driving on the wrong side of a two-way road | 10,626 | 3.0% |
| Improper or erratic lane changing | 6,823 | 1.9% |
| Following improperly | 6,093 | 1.7% |
| Aggressive driving or road rage | 5,311 | 1.5% |
Ranking the factors above and in the previous table together, the five recorded most often in fatal crashes were: an alcohol-impaired driver (29.4%), speeding (27.2%), failure to yield (11.2%), careless or inattentive driving (10.4%) and improper lane usage (9.8%). "Reported impaired" (16.3%) is left out of that ranking because it overlaps with the alcohol measure and also covers drugs and medication. Neither table says why a crash happened. For how fault is decided after a crash, for example a rear-end collision, which is a legal question and not a statistical one, see rear-end collision.
What kind of vehicle is involved?
Counting each vehicle in a fatal crash (2015-2024), 37.9% were passenger cars, 18.5% SUVs and other utility vehicles, 16.5% pickups and other light trucks, 10.5% motorcycles, mopeds and scooters, 9.3% medium or heavy trucks and motorhomes, and 3.8% vans or minivans. Buses were 0.4%. This counts vehicles involved, not vehicles at fault, and it does not adjust for how many of each type are on the road or how far they are driven. See also truck accidents and motorcycle accidents.
Methodology
- Data. NHTSA FARS annual national CSV files, 2015-2024 (accident, vehicle, person, distract, drimpair, driverrf and midrvacc tables). 2024 is the latest year as of 2026-11-09; NHTSA can revise recent years [7].
- Unit. A fatal crash counts once for each factor if any vehicle or driver in it carries the factor. Shares use all fatal crashes in the year as the denominator, including crashes where the field was unknown.
- Speeding. Vehicle table SPEEDREL equal to 2, 3, 4 or 5 (racing; exceeded speed limit; too fast for conditions; specifics unknown).
- Alcohol. Share of ten imputed values of the crash's highest driver BAC (MIDRVACC) at 0.08 to 0.94, averaged over the ten values.
- Distraction. Distract table codes 3-7, 9, 10, 12-15, 17-19, 92, 93, 97 and 98 (named distractions, unspecified distraction or inattention, lost in thought, other); 'Not Distracted', 'Not Reported' and 'Reported as Unknown' are not counted. Mobile phone is codes 5, 6 and 15.
- Fatigue and reported impairment. Drimpair table codes 2 (asleep or fatigued) and 9 (under the influence of alcohol, drugs or medication).
- Driver-related factors. Vehicle DR_SF1-4 for 2015-2019 and the driverrf table for 2020-2024; the factor groups use the same numeric codes in both periods.
- Seat belts. Person table: killed (INJ_SEV = 4) occupants (driver or passenger) of body types 1-49 (cars, SUVs, vans, light trucks). Restrained = shoulder or lap belt, child seat, harness or restraint of unknown type; unrestrained = 'None Used' (code 7 in 2015-2016; code 20, 'None Used/Not Applicable', from 2017); unknown, not reported and other codes are excluded from the share.
- Vehicle type. Vehicle table BODY_TYP groups: 1-9 cars, 14-19 SUV or utility, 10 and 30-48 pickup and light truck, 20-29 van, 50-59 bus, 60-79 medium or heavy truck and motorhome, 80-89 motorcycle, moped or scooter, 90-97 other.
- Check against NHTSA. For 2024 our counts match NHTSA's published speeding deaths (11,288) and alcohol-impaired deaths (11,904) exactly and are one off on distraction (3,207 versus 3,208). Total 2024 deaths are 39,254. Our 48.4% unrestrained compares with NHTSA's 48% for passenger vehicle occupants [5].
- Not counted. Non-fatal crashes, unreported crashes, and any factor that police or investigators did not record. FARS records circumstances; it does not decide fault. Code is Python 3 standard library only (
scripts/w1c-stats-causes.py); charts are plain SVG.
Important notice
CrashFirst is not a law firm and does not give legal advice. This page is general, factual information from public records. A factor recorded in a crash is not a finding of fault, and the figures cannot tell you who is at fault in any crash or predict the outcome of a claim. An attorney can explain how the law applies to your facts.
Data can be quoted with attribution: 'CrashFirst Common Causes of Car Accidents, 2026, based on NHTSA FARS and NMVCCS data.' Attorney review pending. Corrections: tell us and we will update the page.
Keep reading
- Report
Car accident statistics by state: fatal crashes and deaths, 2015-2024.
Traffic deaths in every state and DC from NHTSA FARS, per 100,000 residents and per 100 million miles, with Tennessee, Alabama, Oklahoma and South Carolina marked. CSVs.
Open - Guide
Rear-end collision: what the law says and what to do.
What the following-too-closely laws of Tennessee, Alabama, Oklahoma and South Carolina say, how often federal data records front-to-rear fatal crashes, and what to do after.
Open - Guide
Hit by a drunk driver? What to record and what dram shop law says
Hit by a drunk driver: what to record, who may be liable, NHTSA and FARS death counts, and the dram shop statutes of Tennessee, Alabama, Oklahoma and South Carolina.
Open - Guide
T-bone accident: what it is and who has the right of way.
What a T-bone (side-impact or angle) crash is, the right-of-way rules in Tennessee, Alabama, Oklahoma and South Carolina, and what federal data shows about angle crashes.
Open - Guide
What to do after a crash.
A calm, ordered checklist for the scene, today, the next 72 hours and the next few weeks. Tick it off here or print it for the glove box.
Open - Guide
What to do if you are hit by a car while walking
Pedestrian and driver rules at crosswalks in Tennessee, Alabama, Oklahoma and South Carolina as the statutes read, pedestrian deaths by state from federal data, and the Memphis numbers.
Open
Sources
- NHTSA, Critical Reasons for Crashes Investigated in the National Motor Vehicle Crash Causation Survey (DOT HS 812 115, Feb 2015) (checked November 9, 2026)Official sourceWhere: Table 1 and Table 2Where: Table 2, recognition errorWhere: Table 1, drivers 94%Where: Table 1Where: Summary: weighted sample of 5,470 crashes, 2,189,000 crashes nationwide“it is not intended to be interpreted as the cause of the crash nor as the assignment of the fault to the driver, vehicle, or environment”Where: Table 2, Driver-Related Critical Reasons
- NHTSA, Speeding (checked November 9, 2026)Official source“In 2024, speeding was a contributing factor in 29% of all traffic fatalities.”“In 2024, 11,288 people died in speeding-related traffic deaths.”
- NHTSA, Drunk Driving (checked November 9, 2026)Official source“In 2024, there were 11,904 people killed in these preventable crashes.”
- NHTSA, Distracted Driving (checked November 9, 2026)Official source“In 2024, 3,208 people were killed in motor vehicle crashes involving distracted drivers.”“Distracted driving is any activity that diverts attention from driving”
- NHTSA, Seat Belts (checked November 9, 2026)Official source“Nearly 50% of those killed were not buckled (based on known seat belt use).”“48% Percentage of Passenger Vehicle Occupants Killed in 2024 Who Were Unrestrained”
- NHTSA, Fatality Analysis Reporting System (FARS) overview (checked November 9, 2026)Official source“FARS is a nationwide census providing NHTSA, Congress and the American public yearly data regarding fatal injuries suffered in motor vehicle traffic crashes.”
- NHTSA, FARS national CSV files 2015-2024 (accident, vehicle, person, distract, drimpair, driverrf, midrvacc tables) (checked November 9, 2026)Official sourceWhere: midrvacc.csv, A1 to A10, 2024Where: vehicle.csv, SPEEDREL codes 2 to 5, 2024Where: person.csv, REST_USE for killed occupants in body types 1 to 49, 2015-2024Where: FARS 2015-2024 national CSV: accident, vehicle, person, distract, driverrf, midrvacc
Page last updated November 9, 2026. Attorney review pending. General information, not legal advice. Fees, hours and rules change; confirm on the official page. How we source.
Questions
What causes most car accidents?
NHTSA's crash-causation survey assigned the critical reason to the driver in 94% of the crashes it investigated, most often a recognition error (41%, which includes inattention and distraction) or a decision error (33%, such as driving too fast) [1]. NHTSA says the critical reason is not intended as the cause or as fault.
What is the number 1 cause of car accidents?
No single cause is recorded for all crashes. In the survey, recognition errors were the largest driver group at 41% [1]. In fatal crashes in 2015-2024, an alcohol-impaired driver (29.4%) and speeding (27.2%) were the factors recorded most often, and they overlap.
What are the top 5 causes of car accidents?
In fatal crashes in 2015-2024, the five factors recorded most often were an alcohol-impaired driver (29.4% of crashes), speeding (27.2%), failure to yield (11.2%), careless or inattentive driving (10.4%) and improper lane usage (9.8%). Driver reported impaired by alcohol, drugs or medication (16.3%) overlaps with the first and is left out. These overlap and describe what was recorded, not the cause.
What are the 10 most common causes of car accidents?
From the same fatal-crash records, in order: alcohol-impaired driver, speeding, failure to yield, careless or inattentive driving, improper lane usage, distraction or inattention recorded (8.4%), failure to obey signs or signals (6.3%), operating erratically or recklessly (6.0%), overcorrecting (4.9%) and driving on the wrong side of the road (3.0%). The table above has the counts.
What are 90% of car accidents caused by?
NHTSA's survey assigned the critical reason to a driver in 94% of crashes, but NHTSA says that was not intended to blame the driver [1]. The survey covered 2005-2007 crashes of light vehicles.
Who causes the most car accidents?
The data cannot say, and neither can this page. In the NHTSA survey the critical reason was assigned to drivers in 94% of crashes, to the vehicle in 2% and to the environment in 2% [1]. NHTSA states it is not an assignment of fault; fault in a particular crash is a legal question for an insurer, court or attorney.
What kind of vehicle causes the most accidents?
FARS shows involvement, not cause. Of vehicles in fatal crashes in 2015-2024, 37.9% were passenger cars, 18.5% SUVs, 16.5% pickups and other light trucks, 10.5% motorcycles and 9.3% medium or heavy trucks. The data does not adjust for how many of each type are on the road.
How many fatal crashes involve speeding?
27.2% of fatal crashes in 2015-2024 had a driver recorded as speeding, racing or too fast for conditions, and 28.1% in 2024. NHTSA reports speeding was a contributing factor in 29% of all 2024 traffic fatalities [2].
How many people are killed by distracted drivers?
NHTSA reports 3,208 people killed in 2024 in crashes involving distracted drivers [4]. Our count from the raw files was 3,207. Recorded distraction is a floor; see the note above.