
Home / Reports / Car accident statistics by state: fatal crashes and deaths, 2015-2024
Car accident statistics by state: fatal crashes and deaths, 2015-2024.
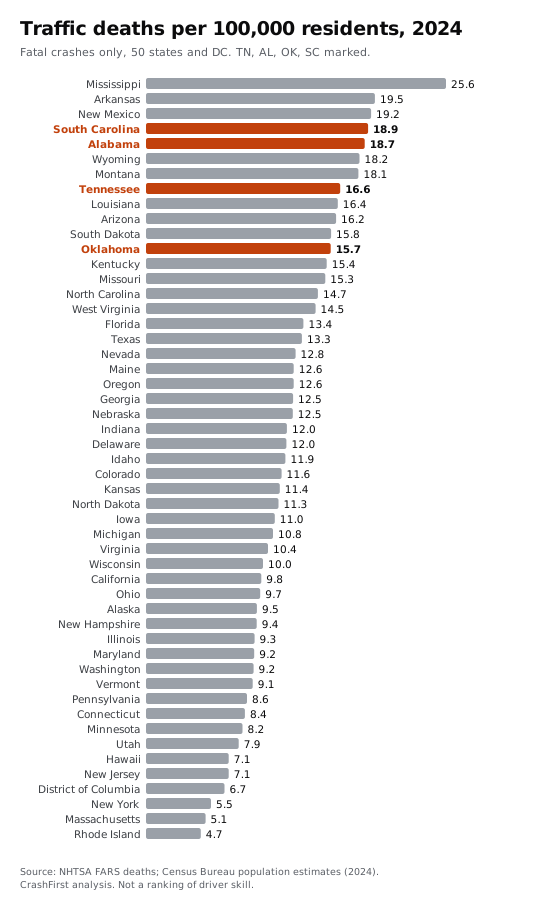
Mississippi had the highest 2024 traffic death rate: 25.6 deaths per 100,000 residents, against 11.5 for the U.S. Tennessee (16.6), Alabama (18.7), Oklahoma (15.7) and South Carolina (18.9) all sat above the national figure. The data counts fatal crashes only. The 2024 figures are the latest available and are subject to revision.
Free, and no is a fine answer.
- Not a law firm
- You never pay us
- No pressure
- Delete your info anytime
Key findings
- Mississippi had the highest death rate in 2024: 25.6 per 100,000 residents. Arkansas (19.5) and New Mexico (19.2) followed; Rhode Island was lowest (4.7). The U.S. rate was 11.5 [1].
- South Carolina ranked 4th, Alabama 5th, Tennessee 8th and Oklahoma 12th of 51 on deaths per 100,000 residents in 2024: 18.9, 18.7, 16.6 and 15.7. On the 2015-2024 average they ranked South Carolina 3rd, Alabama 6th, Oklahoma 10th and Tennessee 11th.
- Per 100 million miles driven, South Carolina was 3rd (1.67) and Tennessee 5th (1.52). Oklahoma was 13th (1.39) and Alabama 17th (1.32). The U.S. rate was 1.19 [1].
- Texas (4,160), California (3,876) and Florida (3,138) had the most deaths in 2024, which mostly reflects population: none of the three is in the top 15 on deaths per 100,000.
- 39,254 people died in U.S. traffic crashes in 2024, down from a peak of 43,230 in 2021. Our count from the raw FARS files matched NHTSA's published total for every one of the 510 state-years.
- FARS counts fatal crashes only. It cannot say which state has the worst drivers or the most crashes of all kinds. A death rate can reflect many things besides driving, and this data does not separate them.
- State ranking: 2024 and 2015-2024 (every state) Ranks, rates, countsCSV
- Fatal crashes and deaths by state and year 510 state-years, with NHTSA cross-checkCSV
- U.S. totals by yearCSV
- NHTSA published deaths and rate per 100M milesCSV
- Census state population used for ratesCSV
- Deaths by age groupCSV
- Deaths by road userCSV
- Fatal crashes by type of collisionCSV
- Fatal crashes by posted speed limitCSV
Quote with attribution: “CrashFirst Car Accident Statistics by State, 2026, based on NHTSA FARS and U.S. Census Bureau data.”

Which states have the highest traffic death rates?
Measured by deaths per 100,000 residents in 2024, Mississippi (25.6), Arkansas (19.5), New Mexico (19.2), South Carolina (18.9) and Alabama (18.7) were highest of the 50 states and DC. Rhode Island (4.7), Massachusetts (5.1) and New York (5.5) were lowest; the U.S. rate was 11.5. The chart marks our four launch states in orange.
What this data is. FARS is "a nationwide census providing NHTSA, Congress and the American public yearly data regarding fatal injuries suffered in motor vehicle traffic crashes." [2] It does not include crashes in which nobody died, so it does not measure who the worst drivers are, who crashes most often or how many crashes there are in total. A state's death rate depends on more than how people drive, and this data cannot separate those factors.
Tennessee, Alabama, Oklahoma and South Carolina
| Tennessee | Alabama | Oklahoma | South Carolina | U.S. | |
|---|---|---|---|---|---|
| Deaths 2024 | 1,197 | 962 | 645 | 1,038 | 39,254 |
| Fatal crashes 2024 | 1,093 | 895 | 594 | 948 | 36,297 |
| Deaths per 100,000 residents, 2024 (rank of 51) | 16.6 (8th) | 18.7 (5th) | 15.7 (12th) | 18.9 (4th) | 11.5 |
| Deaths per 100M miles, 2024 (rank of 51) | 1.52 (5th) | 1.32 (17th) | 1.39 (13th) | 1.67 (3rd) | 1.19 |
| Deaths per 100,000, 2015-2024 average (rank) | 16.8 (11th) | 19.3 (6th) | 17.0 (10th) | 20.3 (3rd) | 11.8 |
| Fatal crashes 2015-2024 | 10,680 | 8,797 | 6,172 | 9,692 | 358,460 |
Deaths per 100 million vehicle miles traveled come from NHTSA's own published table [1]. The two rankings can differ: South Carolina is 4th per resident and 3rd per mile, while Alabama drops from 5th per resident to 17th per mile, which implies more miles driven per resident there. See each state's own guides for what happens after a crash: Tennessee, Alabama, Oklahoma and South Carolina.
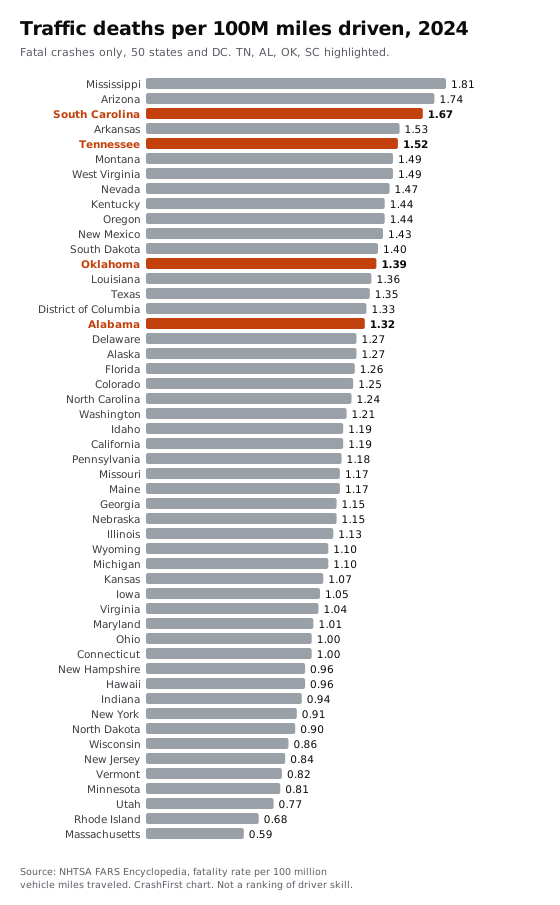
The full ranking, 50 states and DC
Sorted by deaths per 100,000 residents in 2024. Our four launch states are in bold. The same table, with more columns, is in the downloadable CSV.
| Rank | State | Deaths 2024 | Per 100,000 residents | Per 100M miles | Fatal crashes 2015-2024 |
|---|---|---|---|---|---|
| 1 | Mississippi | 753 | 25.6 | 1.81 | 6,385 |
| 2 | Arkansas | 603 | 19.5 | 1.53 | 5,324 |
| 3 | New Mexico | 409 | 19.2 | 1.43 | 3,687 |
| 4 | South Carolina | 1,038 | 18.9 | 1.67 | 9,692 |
| 5 | Alabama | 962 | 18.7 | 1.32 | 8,797 |
| 6 | Wyoming | 107 | 18.2 | 1.10 | 1,111 |
| 7 | Montana | 206 | 18.1 | 1.49 | 1,864 |
| 8 | Tennessee | 1,197 | 16.6 | 1.52 | 10,680 |
| 9 | Louisiana | 752 | 16.4 | 1.36 | 7,467 |
| 10 | Arizona | 1,229 | 16.2 | 1.74 | 9,968 |
| 11 | South Dakota | 146 | 15.8 | 1.40 | 1,174 |
| 12 | Oklahoma | 645 | 15.7 | 1.39 | 6,172 |
| 13 | Kentucky | 707 | 15.4 | 1.44 | 7,075 |
| 14 | Missouri | 955 | 15.3 | 1.17 | 8,801 |
| 15 | North Carolina | 1,619 | 14.7 | 1.24 | 14,061 |
| 16 | West Virginia | 256 | 14.5 | 1.49 | 2,517 |
| 17 | Florida | 3,138 | 13.4 | 1.26 | 30,387 |
| 18 | Texas | 4,160 | 13.3 | 1.35 | 35,785 |
| 19 | Nevada | 417 | 12.8 | 1.47 | 3,275 |
| 20 | Maine | 177 | 12.6 | 1.17 | 1,478 |
| 21 | Oregon | 538 | 12.6 | 1.44 | 4,753 |
| 22 | Georgia | 1,403 | 12.5 | 1.15 | 14,652 |
| 23 | Nebraska | 251 | 12.5 | 1.15 | 2,087 |
| 24 | Indiana | 832 | 12.0 | 0.94 | 8,116 |
| 25 | Delaware | 126 | 12.0 | 1.27 | 1,209 |
| 26 | Idaho | 238 | 11.9 | 1.19 | 2,159 |
| 27 | Colorado | 689 | 11.6 | 1.25 | 6,017 |
| 28 | Kansas | 339 | 11.4 | 1.07 | 3,631 |
| 29 | North Dakota | 90 | 11.3 | 0.90 | 962 |
| 30 | Iowa | 356 | 11.0 | 1.05 | 3,140 |
| 31 | Michigan | 1,098 | 10.8 | 1.10 | 9,800 |
| 32 | Virginia | 917 | 10.4 | 1.04 | 8,138 |
| 33 | Wisconsin | 595 | 10.0 | 0.86 | 5,431 |
| 34 | California | 3,876 | 9.8 | 1.19 | 36,640 |
| 35 | Ohio | 1,157 | 9.7 | 1.00 | 11,013 |
| 36 | Alaska | 70 | 9.5 | 1.27 | 654 |
| 37 | New Hampshire | 133 | 9.4 | 0.96 | 1,135 |
| 38 | Illinois | 1,177 | 9.3 | 1.13 | 10,472 |
| 39 | Maryland | 578 | 9.2 | 1.01 | 5,195 |
| 40 | Washington | 730 | 9.2 | 1.21 | 5,793 |
| 41 | Vermont | 59 | 9.1 | 0.82 | 590 |
| 42 | Pennsylvania | 1,127 | 8.6 | 1.18 | 10,864 |
| 43 | Connecticut | 310 | 8.4 | 1.00 | 2,798 |
| 44 | Minnesota | 477 | 8.2 | 0.81 | 3,788 |
| 45 | Utah | 277 | 7.9 | 0.77 | 2,577 |
| 46 | Hawaii | 102 | 7.1 | 0.96 | 973 |
| 47 | New Jersey | 670 | 7.1 | 0.84 | 5,797 |
| 48 | District of Columbia | 47 | 6.7 | 1.33 | 317 |
| 49 | New York | 1,101 | 5.5 | 0.91 | 10,008 |
| 50 | Massachusetts | 363 | 5.1 | 0.59 | 3,483 |
| 51 | Rhode Island | 52 | 4.7 | 0.68 | 568 |
What state has the most crashes and the most deaths?
Counting fatal crashes over 2015-2024, California had the most (36,640), followed by Texas (35,785), Florida (30,387), Georgia (14,652) and North Carolina (14,061). In 2024 the most deaths were in Texas (4,160), California (3,876) and Florida (3,138). Those are the three most populous states, which is why counts and rates give different answers: in 2024 their rates were 13.3 (Texas), 9.8 (California) and 13.4 (Florida) per 100,000 residents, against 25.6 in Mississippi.
How have deaths changed since 2015?
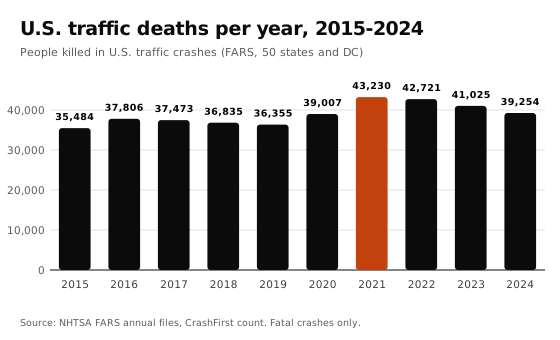
Deaths fell from 37,806 in 2016 to 36,355 in 2019, rose to 39,007 in 2020 and peaked at 43,230 in 2021. They have fallen each year since: 42,721 in 2022, 41,025 in 2023 and 39,254 in 2024. In 2024 there were 36,297 fatal crashes. The national rate was 11.5 deaths per 100,000 residents in 2024, up from 11.1 in 2015, and 1.19 per 100 million miles driven, up from 1.15 in 2015 [1].
Who dies, and in what kind of crash?
Over 2015-2024, 63.0% of people killed were drivers, 17.1% pedestrians, 16.8% passengers and 2.4% bicyclists. The age group with the most deaths was 25-34 (72,422, or 18.6%), followed by 35-44 (57,079), 55-64 (54,854) and 45-54 (53,214). Children 14 and under were 11,145 deaths (2.9%).
By type of collision, 60.7% of fatal crashes (217,576 of 358,460) did not involve a collision with another moving motor vehicle: they were crashes into fixed objects, rollovers, and crashes with pedestrians, cyclists or parked vehicles. Angle crashes made up 18.3%, front-to-front 10.6% and front-to-rear 7.1%.
By the posted speed limit of the road where the crash happened, 29.6% of fatal crashes were on 50-55 mph roads, 24.0% on 40-45 mph roads, 16.5% on 30-35 mph roads, 12.7% on 60-65 mph roads, 8.5% on roads posted 70 mph or above and 5.3% on roads posted 25 mph or less. 3.3% had no speed limit recorded. This is the limit, not the speed of the vehicles. For what the records say about speeding, drinking, distraction and seat belts in fatal crashes, see common causes of car accidents. NHTSA reports that speeding was a contributing factor in 29% of all 2024 traffic fatalities [6].
Methodology
- Fatal crash counts. NHTSA FARS annual national CSV files for 2015-2024. We kept every record in the accident table and grouped by the STATE field (FIPS code: 1 Alabama through 56 Wyoming) and year. Deaths are the FATALS field summed. 2024 is the latest year available as of 2026-11-09; NHTSA can revise recent years [3].
- Check against NHTSA's published totals. NHTSA's FARS Encyclopedia publishes deaths for every state and year. We compared all 510 state-years (51 jurisdictions times 10 years) with our own sums from the raw files: all 510 matched exactly, and the 10 national totals matched (for example 39,254 deaths in 2024 and 43,230 in 2021) [1]. The comparison is in the state-year CSV.
- Rates per 100,000 residents. Deaths divided by that year's Census Bureau resident population estimate for the state. 2020-2024 use Vintage 2024; 2015-2019 use Vintage 2019, so rates across the 2019/2020 line mix two estimate series. The 2015-2024 average is total deaths divided by the sum of ten annual populations [4] [5].
- Rates per 100 million vehicle miles. NHTSA's published rate, copied from the FARS Encyclopedia; we did not compute vehicle miles ourselves.
- Rankings. 1 is the highest rate among 50 states and DC. DC is a single city, not a state; compare it with care.
- Age, road user, collision type and speed limit. National figures from the person table (INJ_SEV = 4, killed), the accident table (manner of collision, MAN_COLL) and the vehicle table (VSPD_LIM, the highest posted limit among vehicles in the crash). The files label non-collision crashes differently in different years; we combined the two labels.
- Not counted. Non-fatal crashes, unreported crashes, Puerto Rico and U.S. territories.
- Reproduce it. The cleaned CSVs are on this page. Code is Python 3 standard library only (
scripts/w1c-stats-state.py); charts are plain SVG.
Important notice
CrashFirst is not a law firm and does not give legal advice. This page is general, factual information from public records. It does not say who is at fault in any crash and cannot predict the outcome of any claim. An attorney can explain how the law applies to your facts.
Data can be quoted with attribution: 'CrashFirst Car Accident Statistics by State, 2026, based on NHTSA FARS and U.S. Census Bureau data.' Attorney review pending. Corrections: tell us and we will update the page.
Keep reading
- Report
What causes most car accidents? Federal crash data, 2015-2024.
What causes most car accidents? NHTSA's crash-causation survey and 10 years of fatal-crash records (speeding, alcohol, distraction, seat belts, driver errors), with CSVs.
Open - Guide
What to do after a crash.
A calm, ordered checklist for the scene, today, the next 72 hours and the next few weeks. Tick it off here or print it for the glove box.
Open - Guide
What to do if you are hit by a car while walking
Pedestrian and driver rules at crosswalks in Tennessee, Alabama, Oklahoma and South Carolina as the statutes read, pedestrian deaths by state from federal data, and the Memphis numbers.
Open - Guide
What to do after a motorcycle accident
What to do after a motorcycle accident, helmet laws as written in Tennessee, Alabama, Oklahoma and South Carolina, lane rules, and motorcyclist deaths by state from federal data.
Open - Guide
What to do after a truck accident
What to do after a truck or 18-wheeler accident: how to look up the carrier, what an ELD is, federal hours and insurance rules, state links and Memphis data. Nov 2026.
Open - Reference
Car accident injury deadlines: Tennessee, Alabama, Georgia, Mississippi, Oklahoma and South Carolina
Filing deadlines for car accident injury claims in Tennessee, Alabama, Georgia, Mississippi, Oklahoma and South Carolina, with statute citations. More states coming. Nov 2026.
Open
Sources
- NHTSA, FARS Encyclopedia: state fatalities and fatality rates per 100 million vehicle miles traveled, 1994-2024 (checked November 9, 2026)Official sourceWhere: Fatalities by state, 2024 columnWhere: USA row, fatalities 2015-2024Where: USA row, fatalities 2019-2020Where: Fatality Rate per 100 Million Vehicle Miles Traveled, 2024 columnWhere: USA row, 2015 and 2024Where: Fatalities by state, 2015-2024 columns, all rows
- NHTSA, Fatality Analysis Reporting System (FARS) overview (checked November 9, 2026)Official source“FARS is a nationwide census providing NHTSA, Congress and the American public yearly data regarding fatal injuries suffered in motor vehicle traffic crashes.”
- NHTSA, FARS national CSV files 2015-2024 (accident, person, vehicle tables) (checked November 9, 2026)Official sourceWhere: FARS 2015-2024 accident.csv: STATE, YEAR, FATALS
- U.S. Census Bureau, Vintage 2024 state population estimates (2020-2024) (checked November 9, 2026)Official sourceWhere: POPESTIMATE2024 by state, SUMLEV 040
- U.S. Census Bureau, Vintage 2019 state population estimates (2010-2019) (checked November 9, 2026)Official sourceWhere: POPESTIMATE2015 to POPESTIMATE2019 by state, SUMLEV 040
- NHTSA, Speeding (2024 national speeding-related deaths) (checked November 9, 2026)Official source“In 2024, speeding was a contributing factor in 29% of all traffic fatalities.”
Page last updated November 9, 2026. Attorney review pending. General information, not legal advice. Fees, hours and rules change; confirm on the official page. How we source.
Questions
What state has the highest car accident rate?
On the one measure this data covers, deaths in fatal crashes, Mississippi was highest in 2024 at 25.6 deaths per 100,000 residents; the U.S. figure was 11.5 [1]. FARS does not count non-fatal crashes, so it cannot rank states on all accidents.
What state has the most car accidents per capita?
For fatal crashes, Mississippi: 678 fatal crashes and 753 deaths in 2024 for 2.94 million residents, or 25.6 deaths per 100,000. Arkansas and New Mexico were next. Per-capita counts of all crashes, including minor ones, are not in this data.
Which state has the highest number of car accident deaths?
Texas, with 4,160 deaths in 2024, then California (3,876) and Florida (3,138) [1]. These are the largest states by population; see the per-resident and per-mile tables for how they compare.
What state in the US has the most crashes?
Among fatal crashes, California had the most over 2015-2024 (36,640), then Texas (35,785) and Florida (30,387). That is a count, not a rate, and it excludes crashes in which no one died.
Which state has the worst drivers?
This data does not measure driving skill or fault. It counts deaths and fatal crashes, which can depend on many things besides the driver. The ranking above shows where fatal crashes are most frequent for each resident or each mile driven.
What year had the most car crash deaths?
Among 2015-2024, 2021 with 43,230 deaths, then 42,721 in 2022 and 41,025 in 2023. 2024 had 39,254, and 2015 had 35,484 [1].
How many people died in a car crash in 2020?
39,007 people died in fatal crashes in the 50 states and DC in 2020, in 35,935 fatal crashes, up from 36,355 deaths in 2019 [1].
What age group has the most fatal crash deaths?
People 25 to 34: 72,422 of the 389,190 deaths over 2015-2024 (18.6%). Ages 35-44 were next at 14.7%, and 55-64 at 14.1%. These are counts of deaths, not a risk per driver, since age groups differ in size and miles driven.
At what speed do most fatal crashes occur?
FARS records the posted speed limit of the road, not the speed each driver was going. The most fatal crashes, 29.6%, were on roads posted 50-55 mph, then 24.0% at 40-45 mph and 16.5% at 30-35 mph. 12.7% were at 60-65 mph and 8.5% at 70 mph or more.
What are the types of fatal crashes?
By FARS manner of collision, 60.7% of fatal crashes (2015-2024) were not a collision with a motor vehicle in transport (for example a crash into a fixed object, a rollover or a pedestrian). Angle crashes were 18.3%, front-to-front 10.6% and front-to-rear 7.1%.
Who dies most often in fatal crashes?
Drivers: 63.0% of deaths over 2015-2024, then pedestrians (17.1%) and passengers (16.8%). Bicyclists were 2.4%.