
Data: NHTSA Fatality Analysis Reporting System (FARS), 2015 to 2024 [1]. Counts of fatal crashes, not risk per mile, and not a statement about who was at fault. Last updated November 9, 2026. Part of The Tulsa Crash Report 2026.
The corridors, ranked
| Rank | Road | Fatal crashes, 2015 to 2024 | People killed | Fatal crashes, 2020 to 2024 |
|---|---|---|---|---|
| 1 | US-75 | 50 | 54 | 32 |
| 2 | I-244 | 46 | 51 | 29 |
| 3 | I-44 | 42 | 43 | 27 |
| 4 | US-169 | 36 | 41 | 22 |
| 5 | US-64 | 32 | 35 | 12 |
| 6 | Peoria Ave | 24 | 24 | 12 |
| 7 | Sheridan Rd | 19 | 19 | outside the top 10 |
| 8 | SR-11 | 19 | 20 | 11 |
| 9 | Admiral Pl | 18 | 18 | outside the top 10 |
| 10 | 41st St | 18 | 23 | 12 |
| 11 | Yale Ave | 17 | 19 | 13 |
| 12 | Memorial Dr | 16 | 16 | outside the top 10 |
| 13 | Garnett Rd | 16 | 16 | outside the top 10 |
| 14 | SR-51 | 15 | 17 | outside the top 10 |
| 15 | Lewis Ave | 15 | 15 | outside the top 10 |
How to read it: a "corridor" is one road, with variants of the same road combined (for example north and south segments of Yale Avenue, or a road's ramps). Route numbers (US-75, I-244, I-44, US-169, US-64, SR-11, SR-51) are shown the way the federal data records them; street names are shown only where the data's own road-name field carries them. Counts are the primary road recorded for each fatal crash. Roads with more traffic, more miles or more intersections will have more crashes; this table does not correct for that [2]. Since 2020, US-75 (32), I-244 (29) and I-44 (27) lead, with US-169 (22) next.
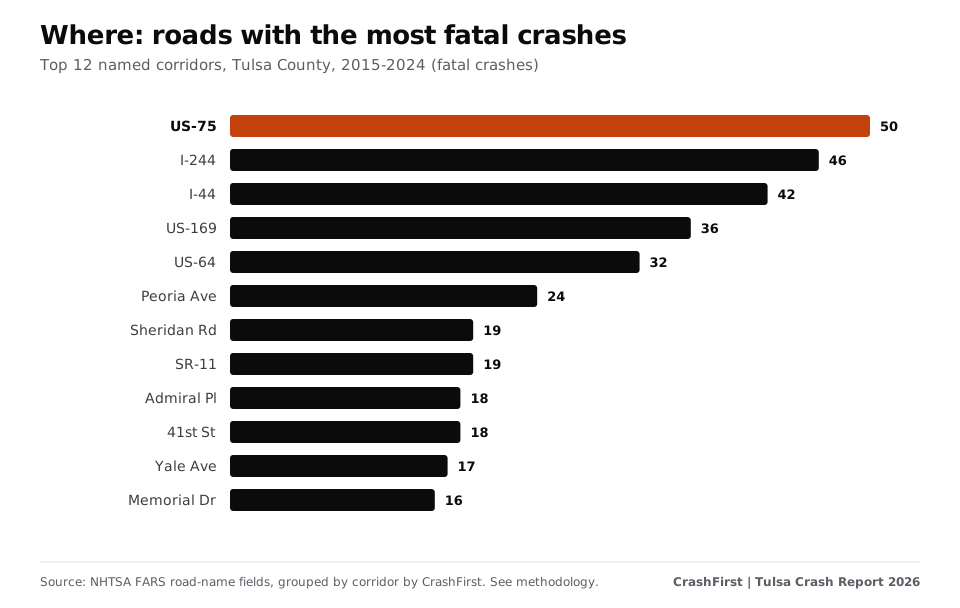
The top five roads account for 28% of all fatal crashes in the county.
Map
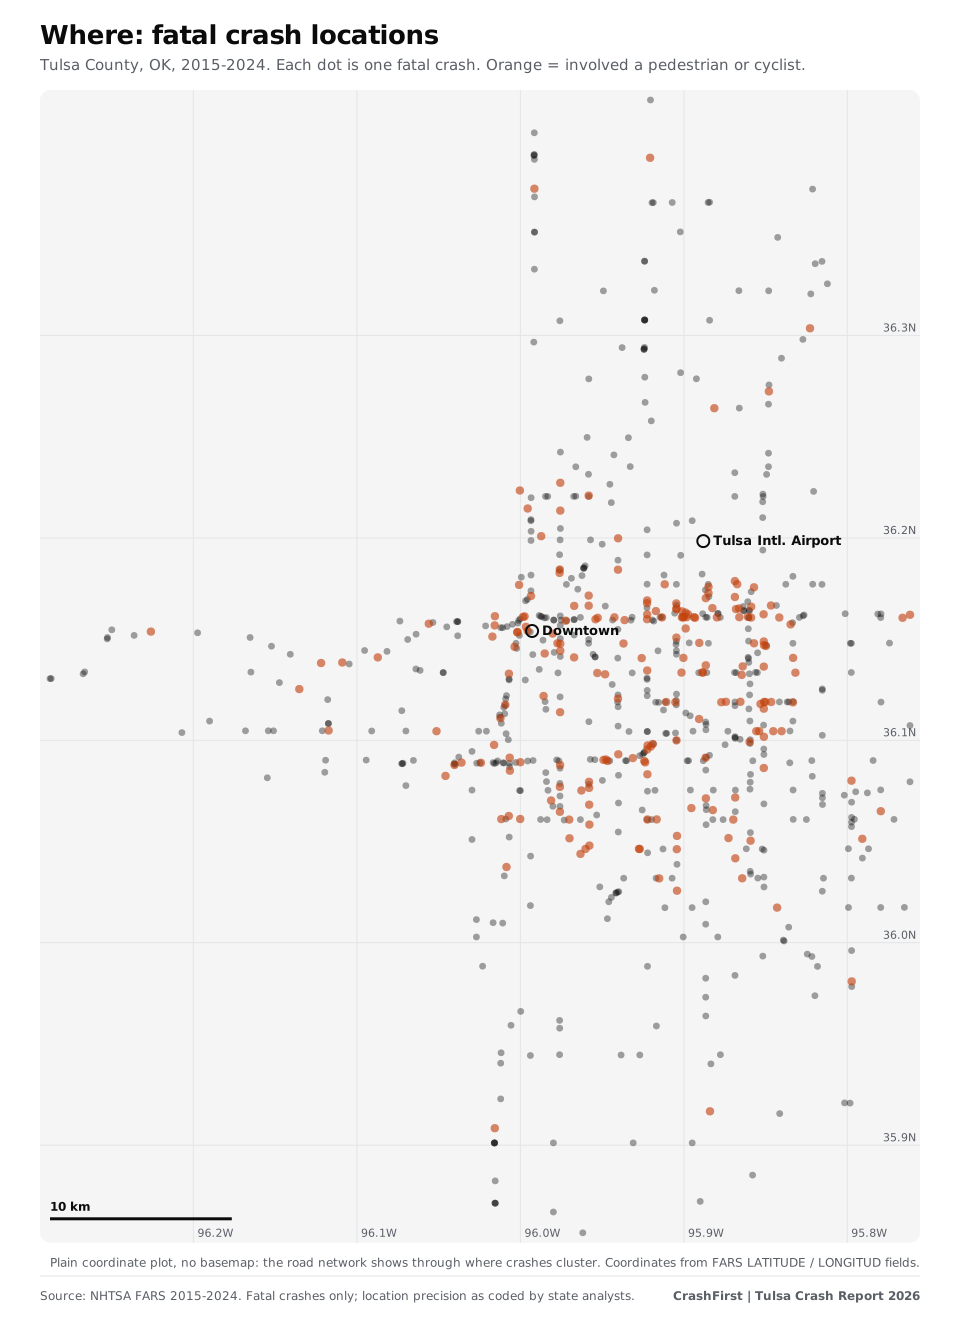
Dense lines of dots are roads where people have died repeatedly. Orange dots involve a person on foot or on a bicycle.
When: nights and weekends
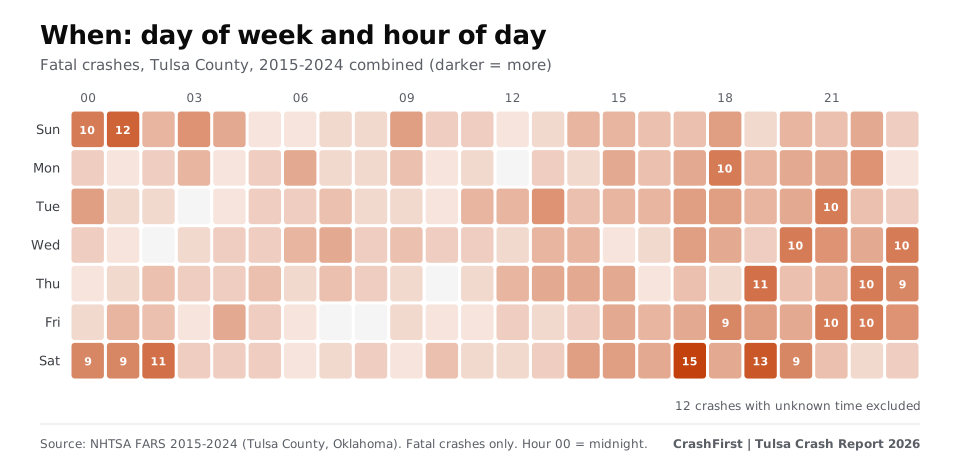
- Time of day: 40% of fatal crashes with a known time happened between 8 p.m. and 4 a.m.
- Day of week: 46% fell on a Friday, Saturday or Sunday; if crashes were spread evenly across the week, three days would be 43%.
- Busiest slot: Saturday at 5 p.m., with 15 fatal crashes over ten years.
- Month: November had the most (82 over ten years); February the fewest (43).
- Darkness: 56% happened in the dark, including 227 crashes on roads that were not lighted.
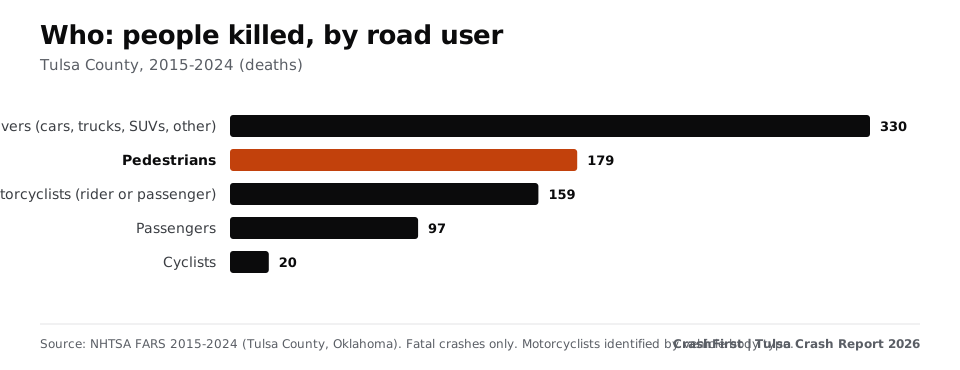
Who: pedestrians and people on motorcycles
| Road user | People killed, 2015 to 2024 |
|---|---|
| Drivers | 330 |
| Pedestrians | 179 |
| Motorcyclists (rider or passenger) | 159 |
| Passengers | 97 |
| Cyclists | 20 |
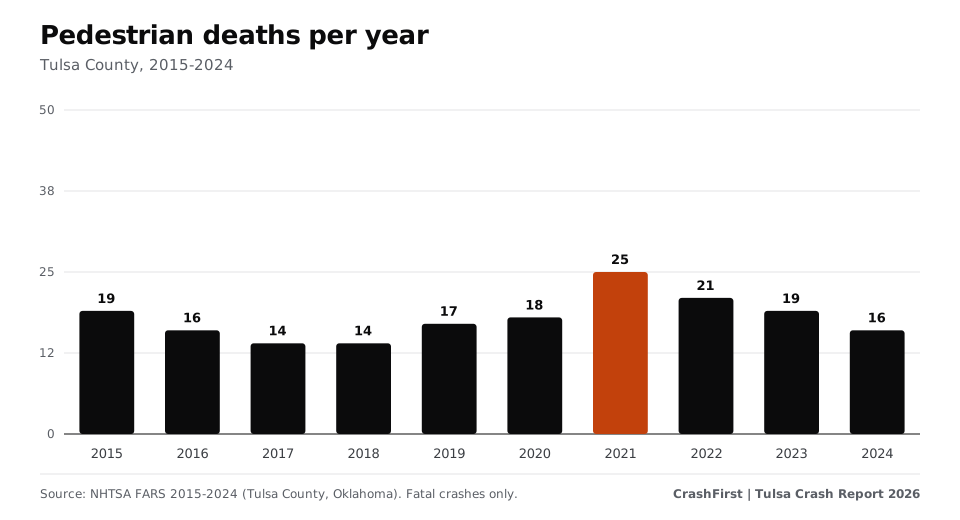
Nearly one in four people killed was on foot (23%). Pedestrian deaths peaked at 25 in 2021, and 81% of fatal crashes involving a pedestrian happened in the dark. Motorcyclist deaths rose from 7 in 2019 to 30 in 2024.
How Tulsa County compares
In 2024, Tulsa County recorded 12.6 traffic deaths per 100,000 residents, compared with 16.3 for Oklahoma and 11.8 for the United States (the City of Tulsa alone: 15.2). The county holds 16.9% of Oklahoma's residents but had 13.0% of the state's 2024 traffic deaths. Annual deaths were between 53 and 72 from 2015 to 2019, then 80 to 106 from 2020 to 2024, peaking at 106 in 2021; the count was 84 in 2024 [3].
This edition uses only fatal-crash records. FARS does not count crashes in which nobody died, and Oklahoma's all-crash records were not used.
What was involved
Over 2015 to 2024, 231 fatal crashes (31%) were speeding-related, 142 (19%) involved a driver who was drinking or tested at 0.08 or above, 72 (10%) were hit-and-run, 66 (9%) involved a large truck and 154 (21%) a motorcycle. These flags overlap and describe the crash, not who caused it.
What the data does and does not say
- A crash being on a road says something about exposure (traffic, speed, design). It does not say who was at fault.
- FARS counts only crashes in which someone died. Most crashes are not fatal.
- 2025 is not included; 2024 is the latest year available.
If you were hurt on one of these roads
Keep records of where and when it happened, the report number, photos, witnesses and your treatment. See what to do after a car accident in Tulsa, how to get your crash report, and the free after-a-crash checklist.
Download the data
Corridor table (CSV) | Full Tulsa Crash Report 2026 | Methodology
Cite as: "CrashFirst Tulsa Crash Report 2026, based on NHTSA FARS data."
Sources
- NHTSA, Fatality Analysis Reporting System (FARS) (checked November 9, 2026)Where: FARS data documentation and annual file downloads, 2015-2024
- NHTSA FARS annual national CSV file downloads, 2015-2024 (checked November 9, 2026)Where: FARS annual national CSV files 2015-2024, STATE 40, COUNTY 143, primary road (TWAY_ID), grouped by CrashFirst
- U.S. Census Bureau, Vintage 2024 population estimates, 2020-2024 datasets (April 2020 base) (checked November 9, 2026)Where: Vintage 2024 population estimates (April 1, 2020 base): Tulsa County, Oklahoma; Oklahoma; United States
Page last updated November 9, 2026. Attorney review pending. General information, not legal advice. Fees, hours and rules change; confirm on the official page. How we source.
Questions
What is the most dangerous road in Tulsa?
By fatal crashes in Tulsa County from 2015 to 2024, US-75 (50), I-244 (46) and I-44 (42). Since 2020 the same three lead, with 32, 29 and 27. These are counts, not risk per mile.
Are Tulsa crashes mostly on highways?
No. 63% of fatal crashes were on principal or minor arterial streets; 12% on interstates and a further 8% on other freeways and expressways (20% together).
When do most fatal crashes happen in Tulsa?
Evenings and overnight, especially on weekends: 40% of those with a known time between 8 p.m. and 4 a.m., and 46% on a Friday, Saturday or Sunday.
How many pedestrians die in Tulsa County crashes?
179 people on foot died in Tulsa County fatal crashes from 2015 to 2024 (23% of deaths).
Where does the data come from?
NHTSA's Fatality Analysis Reporting System; see the methodology section of the full report. It counts only crashes in which someone died and does not say who was at fault.
The state rules
Deadlines, fault and reports for all of Oklahoma are in the Oklahoma reference.
Keep reading
- Report
The Tulsa Crash Report 2026.
Where, when and to whom serious crashes happen in Tulsa and Tulsa County, Oklahoma, from NHTSA FARS data, 2015-2024. Charts and CSVs.
Open - City guide
How to get a Tulsa police crash report
Who wrote your Tulsa crash report and how to request it: Tulsa Police open records and Service Oklahoma ($7 / $10 certified) for state reports. Checked Nov 2026.
Open - City guide
What to do after a car accident in Tulsa
Tulsa car accident steps: who to call, how to get your crash report, local hospital notes and Oklahoma rules on deadlines and reporting. Checked Nov 2026.
Open - State reference
Oklahoma statute of limitations for car accident injury claims
Oklahoma gives two years for most injury claims after a crash and for wrongful death. Exact statute text, the one-year government claim rule and exceptions.
Open - Free download
Your first-hour checklist, ready to print.
A one-page printable first-hour checklist for after a crash: safety, police, photos, doctor, insurer. Free PDF, no sign-up.
Open