
Home / Reports / The Tulsa Crash Report 2026
The Tulsa Crash Report 2026.
Where, when and to whom serious crashes happen in Tulsa and Tulsa County, Oklahoma. Built from public federal fatal-crash records, 2015-2024.
Free, and no is a fine answer.
- Not a law firm
- You never pay us
- No pressure
- Delete your info anytime
Key findings
- 792 people died in 740 fatal crashes in Tulsa County, Oklahoma, from 2015 to 2024 (NHTSA FARS). 73% of those crashes carry the City of Tulsa location code.
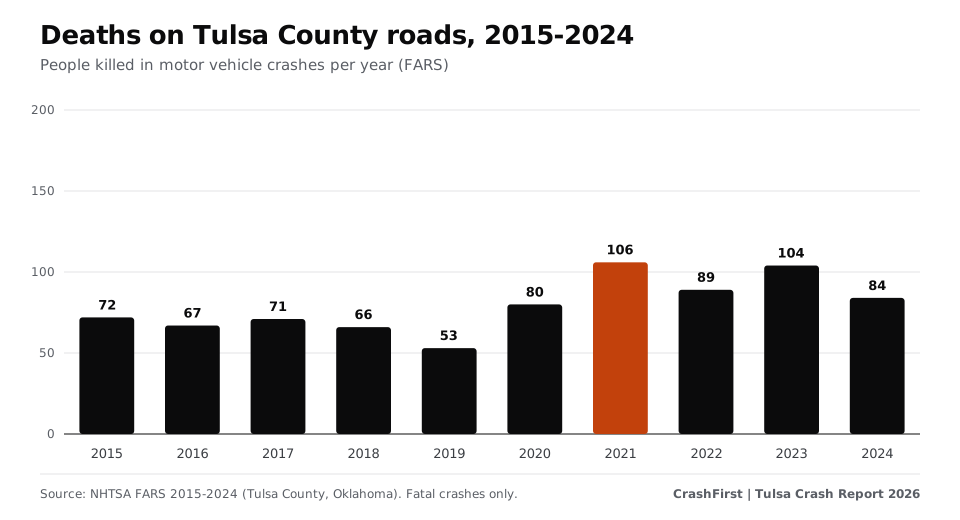
- Annual deaths ranged from 53 to 106. 72 in 2015, 53 in 2019, 80 in 2020 (+51% in one year), a peak of 106 in 2021, and 84 in 2024 (+58% versus 2019).
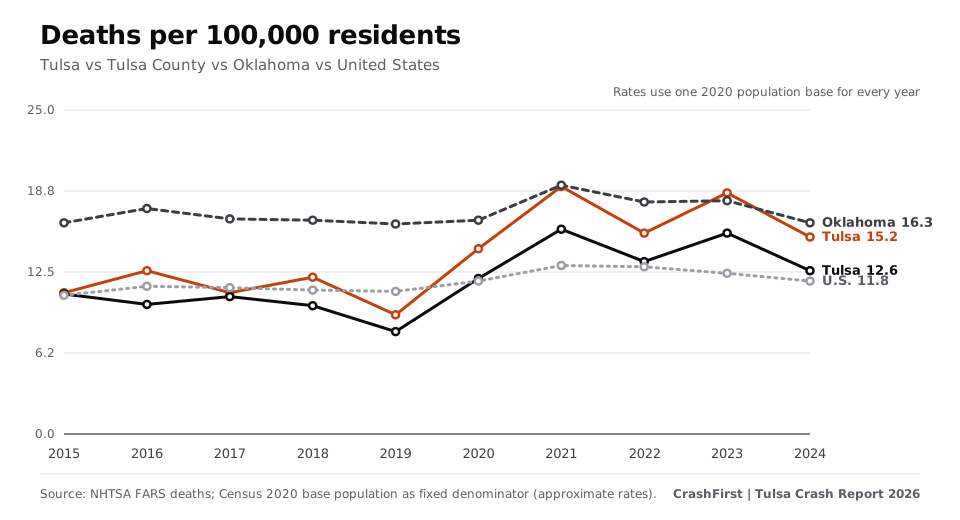
- The death rate is 1.1 times the national rate. 12.6 deaths per 100,000 residents in 2024 versus 16.3 for Oklahoma and 11.8 for the U.S. (Tulsa alone: 15.2). Ten-year average: 11.8 for Tulsa County, 17.1 for Oklahoma, 11.7 for the U.S. Tulsa County holds 16.9% of Oklahoma's residents and had 13.0% of the state's 2024 traffic deaths.
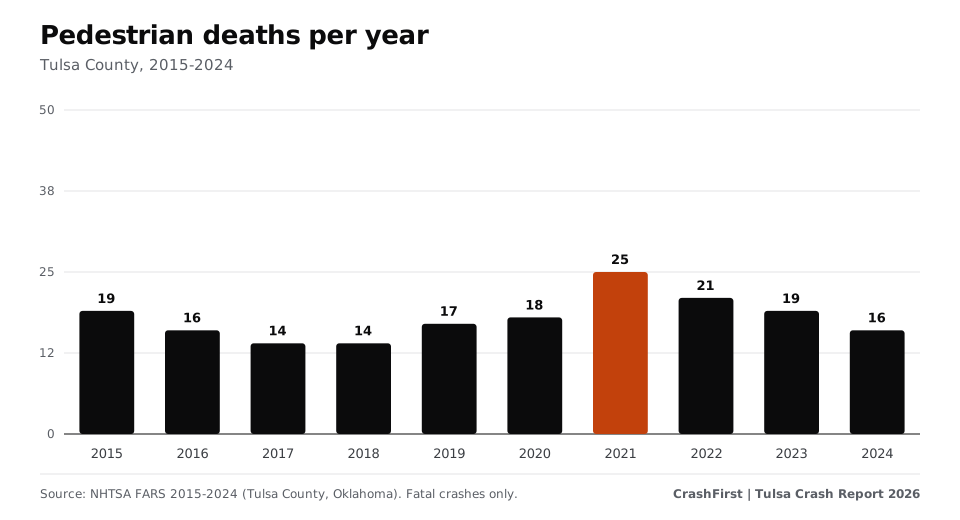
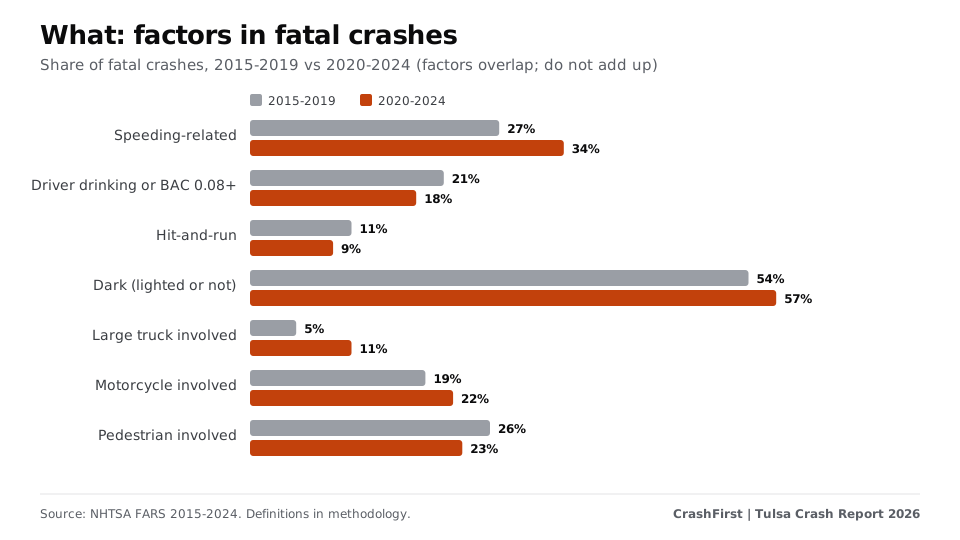
- 23% of people killed were on foot. 179 pedestrians died, peaking at 25 in 2021. 81% of fatal crashes involving a pedestrian happened in the dark.
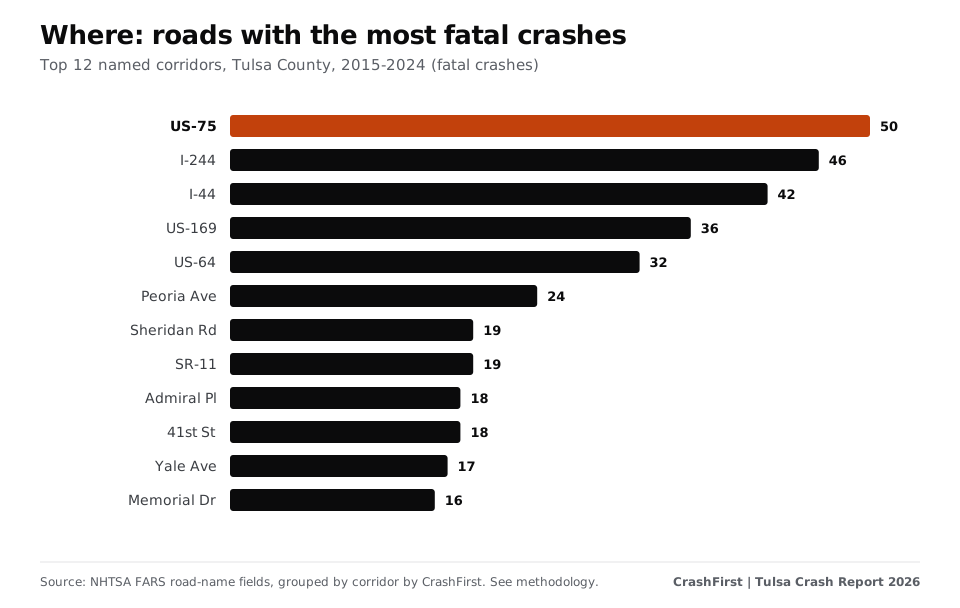
- Where: 12% of fatal crashes were on interstates, a further 8% on other freeways and expressways (20% together), and 63% on principal or minor arterials. The three corridors with the most fatal crashes are US-75 (50), I-244 (46) and I-44 (42).
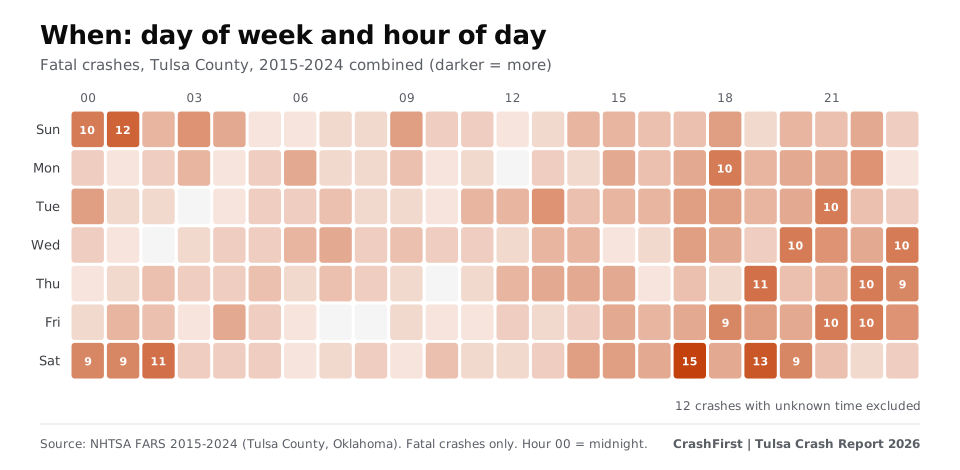
- Nights and weekends. 40% of fatal crashes with a known time happened between 8 p.m. and 4 a.m.; 46% fell on a Friday, Saturday or Sunday (three days would be 43% if evenly spread). The busiest slot was Sat at 17:00 (15 fatal crashes over ten years).
- Hit-and-run. Fatal crashes where a driver fled went from 6 in 2015 to 4 in 2024 (peak 10); 11% of fatal crashes in 2015-2019 versus 9% in 2020-2024.
- Full report (PDF) Charts, method and sourcesPDF
- One-page summary (PDF) Press-readyPDF
- Deaths and crashes by yearCSV
- Fatal crashes by corridorCSV
- Every Tulsa County fatal crash (FARS)CSV
- Every person involved (FARS)CSV
- Oklahoma and U.S. totalsCSV
Quote with attribution: “CrashFirst Tulsa Crash Report 2026, based on NHTSA FARS data.”
How has it changed?
From 2015 to 2019 Tulsa County recorded between 53 and 72 traffic deaths a year; from 2020 to 2024 between 80 and 106. Across 2015-2019 there were 329 deaths; across 2020-2024 there were 463. Nationally deaths went from 36,355 in 2019 to 39,254 in 2024; in Oklahoma from 640 to 645 [2].
Where: the corridors
FARS records the road name and coordinates of every fatal crash [1]. Grouping the 740 crashes that carry a road name by corridor, the top five roads account for 28% of all fatal crashes. Since 2020 the top corridors by fatal crashes are: US-75 (32); I-244 (29); I-44 (27); US-169 (22); Yale Ave (13); 41st St (12).
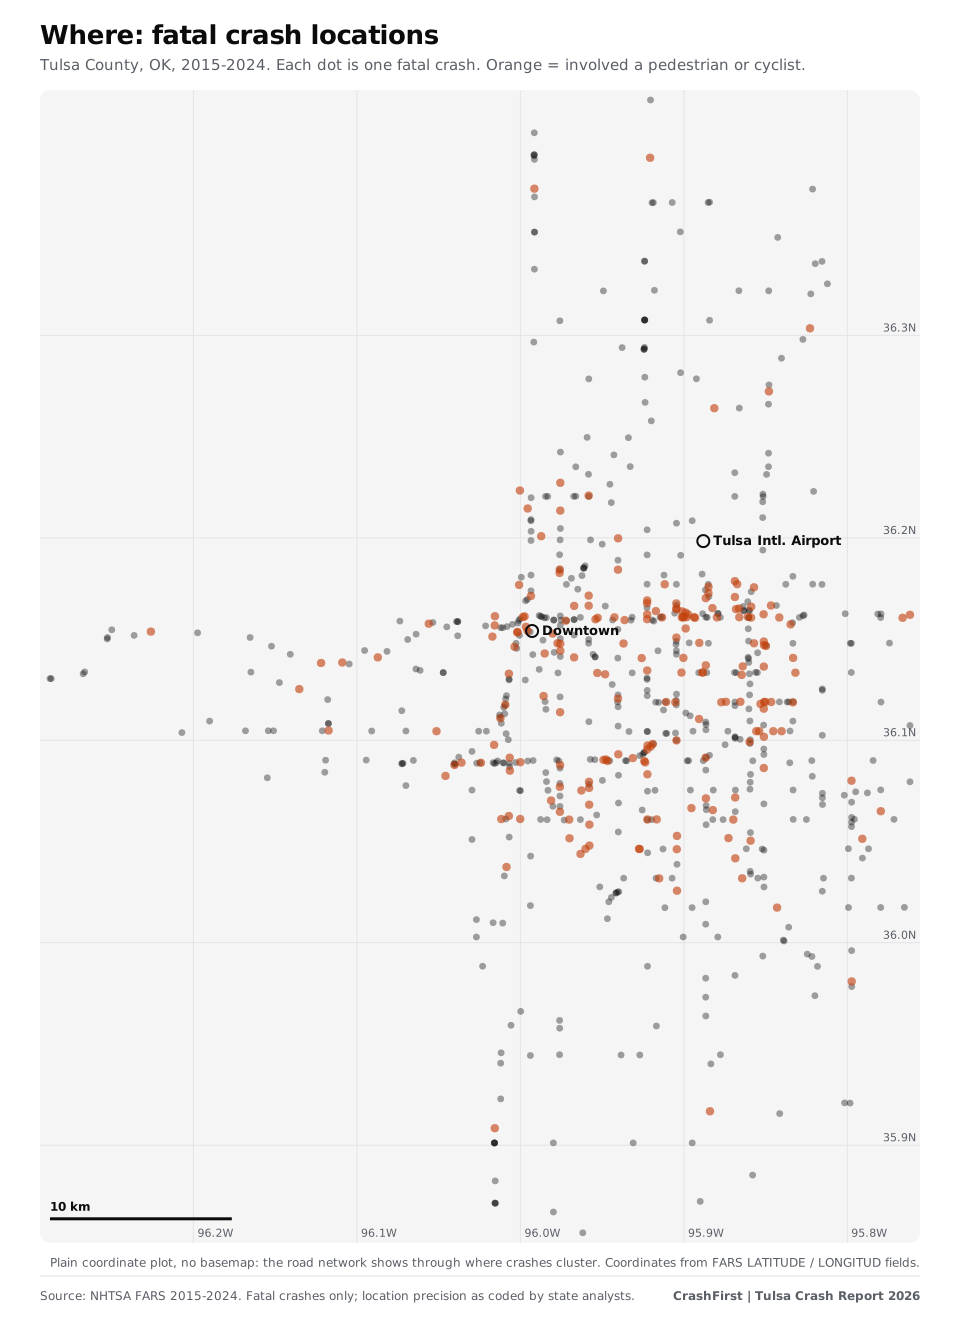
Reading the map: dense lines of dots are roads where people have died repeatedly. Orange dots involve a pedestrian or cyclist. A crash being on a road says something about exposure (traffic volume, speed, design); it does not say who was at fault.
When: months, days, hours
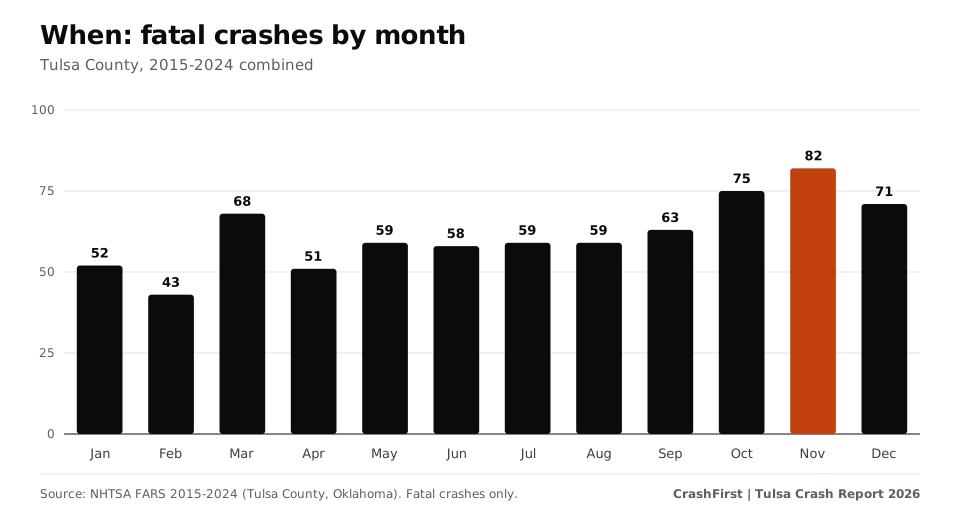
Fatal crashes are spread across the year, with Nov the highest month (82 over ten years) and Feb the lowest (43). The pattern by hour matters more.
Who: people on foot, motorcyclists, drivers
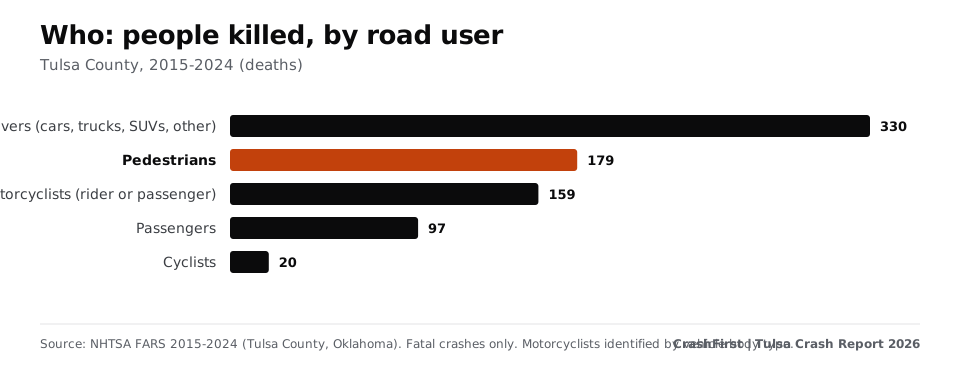
Deaths by road-user type, 2015-2024: drivers (cars, trucks, SUVs, other): 330, pedestrians: 179, motorcyclists (rider or passenger): 159, passengers: 97, cyclists: 20. The largest age group among those killed was 25-34 (151). 19 children under 15 died.
What was involved
FARS flags contributing circumstances. Over 2015-2024, 231 fatal crashes (31%) were speeding-related, 142 (19%) involved a driver who was drinking or tested at 0.08 or above, 72 (10%) were hit-and-run, 66 (9%) involved a large truck and 154 (21%) a motorcycle. 56% happened in the dark. These flags overlap and describe the crash, not who caused it.
What this means for people on Tulsa roads
- Interstates carry 12% of fatal crashes (20% with other freeways and expressways) and arterial streets 63%.
- People on foot account for 23% of deaths; 81% of those crashes were after dark.
- If you are hurt in a crash, keep records: where and when it happened, the police report number, photos, names of witnesses, your treatment and bills. See our free printable checklist and journal.
Methodology
- Fatal crash data: NHTSA Fatality Analysis Reporting System (FARS) annual national CSV files for 2015-2024, downloaded from the FARS downloads page linked in Sources. 2024 is the latest year available as of 2026-11-09; NHTSA may revise recent years. We kept records with STATE=40 (Oklahoma) and COUNTY in 143 (Tulsa County).
- Tulsa vs county: crashes with FARS city code 4780 (Tulsa) are labelled Tulsa; all other crashes in the county area are 'other' (suburbs, other towns, unincorporated). Code 4780 appears on 73% of records.
- Rates: deaths divided by a fixed April 2020 population base and multiplied by 100,000. Census Bureau Vintage 2024 estimates base (April 1, 2020): Tulsa city 413,143; Tulsa County 669,260; Oklahoma 3,959,405; U.S. 331,515,736. A single base is used for every year, so rates are approximate [3].
- Corridors: FARS TWAY_ID (primary road name) grouped by us to combine variants (for example 'I-44' with ramp suffixes, and street names that differ only by direction prefix). Only the primary road is counted. Corridors are counts of fatal crashes, not risk per mile or per vehicle. Crashes with no road name are not in the corridor ranking.
- Road user: FARS PER_TYP; motorcyclists identified from vehicle body type 80-89. 'Alcohol' means a driver with police-reported drinking or a test result of 0.08+; 'speeding' means FARS marks any vehicle as speed-related; 'dark' includes lighted and unlighted roads. Crashes with unknown hour are excluded from time-of-day charts.
- Not counted: crashes where nobody died, unreported crashes, and anything after FARS's latest year. This edition uses FARS only; state crash databases (all crashes) are a later addition.
- Reproduce it: the cleaned CSVs are downloadable on this page. Raw NHTSA files are the public FARS downloads linked in Sources; code is Python 3 using only the standard library, charts are plain SVG.
Important notice
CrashFirst is not a law firm and does not give legal advice. This report is general, factual information drawn from public records. It does not say who is at fault in any crash and is not a substitute for advice from a licensed attorney. Crash figures are counts of recorded events, not predictions about any person's safety or claim.
Data can be quoted with attribution: 'CrashFirst Tulsa Crash Report 2026, based on NHTSA FARS data.' Corrections: tell us and we will update the report.
Keep reading
- City guide
Most dangerous roads in Tulsa: where fatal crashes happen
Which Tulsa County roads had the most fatal crashes 2015-2024: US-75, I-244, I-44 and more. Times, pedestrians, charts and a free CSV from NHTSA data.
Open - City guide
What to do after a car accident in Tulsa
Tulsa car accident steps: who to call, how to get your crash report, local hospital notes and Oklahoma rules on deadlines and reporting. Checked Nov 2026.
Open - City guide
How to get a Tulsa police crash report
Who wrote your Tulsa crash report and how to request it: Tulsa Police open records and Service Oklahoma ($7 / $10 certified) for state reports. Checked Nov 2026.
Open - Free download
Your first-hour checklist, ready to print.
A one-page printable first-hour checklist for after a crash: safety, police, photos, doctor, insurer. Free PDF, no sign-up.
Open
Sources
- NHTSA, Fatality Analysis Reporting System (FARS), 2015-2024 national CSV files (checked November 9, 2026)Where: FARS data documentation, road name (TWAY_ID) and location fields
- NHTSA FARS annual national CSV file downloads (checked November 9, 2026)Where: FARS annual national CSV files 2015-2024, state and national fatality totals
- U.S. Census Bureau, Vintage 2024 population estimates, 2020-2024 datasets (April 2020 base) (checked November 9, 2026)Where: Vintage 2024 population estimates, April 1, 2020 base: city, county, state and United States
Page last updated November 9, 2026. Attorney review pending. General information, not legal advice. Fees, hours and rules change; confirm on the official page. How we source.