
The corridors, ranked
| Rank | Road | Fatal crashes, 2015 to 2024 | People killed | Fatal crashes, 2020 to 2024 |
|---|---|---|---|---|
| 1 | I-240 | 95 | 106 | 56 |
| 2 | I-40 | 91 | 99 | 50 |
| 3 | Shelby Dr (SR-175) | 87 | 98 | 56 |
| 4 | S Third St (US-61) | 70 | 79 | 48 |
| 5 | Winchester Rd | 69 | 71 | 44 |
| 6 | Lamar Ave (US-78) | 60 | 63 | 33 |
| 7 | Jackson Ave (SR-14) | 52 | 54 | 33 |
| 8 | Summer Ave (US-64/70) | 38 | 44 | 26 |
| 9 | Poplar Ave (US-72) | 37 | 40 | 22 |
| 10 | Thomas St (US-51) | 31 | 32 | outside the top 10 |
| 11 | Austin Peay Hwy (SR-14) | 30 | 32 | outside the top 10 |
| 12 | Elvis Presley Blvd (US-51) | 30 | 31 | 20 |
| 13 | Chelsea Ave | 28 | 31 | outside the top 10 |
| 14 | I-55 | 27 | 30 | outside the top 10 |
| 15 | Bill Morris Pkwy (SR-385) | 23 | 23 | outside the top 10 |
How to read it: a "corridor" is one named road, with name variants combined (for example SR-175 and SR-175 East Shelby Drive). Counts are the primary road recorded for each fatal crash. Roads with more traffic, more miles or more intersections will have more crashes; this table does not correct for that. Since 2020, Shelby Drive and I-240 are tied at 56 fatal crashes each.
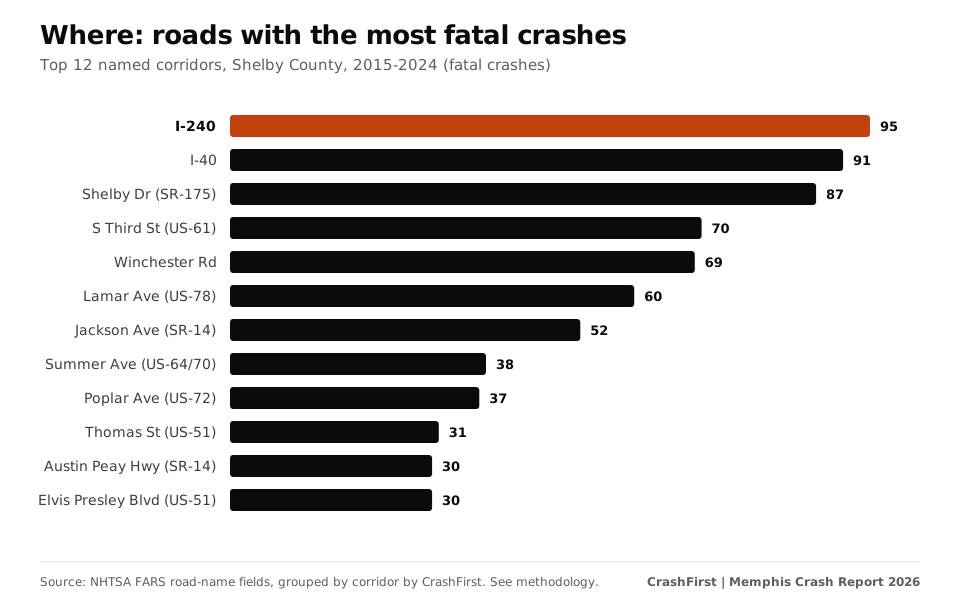
The top five roads account for 23% of all fatal crashes in the county.
Map
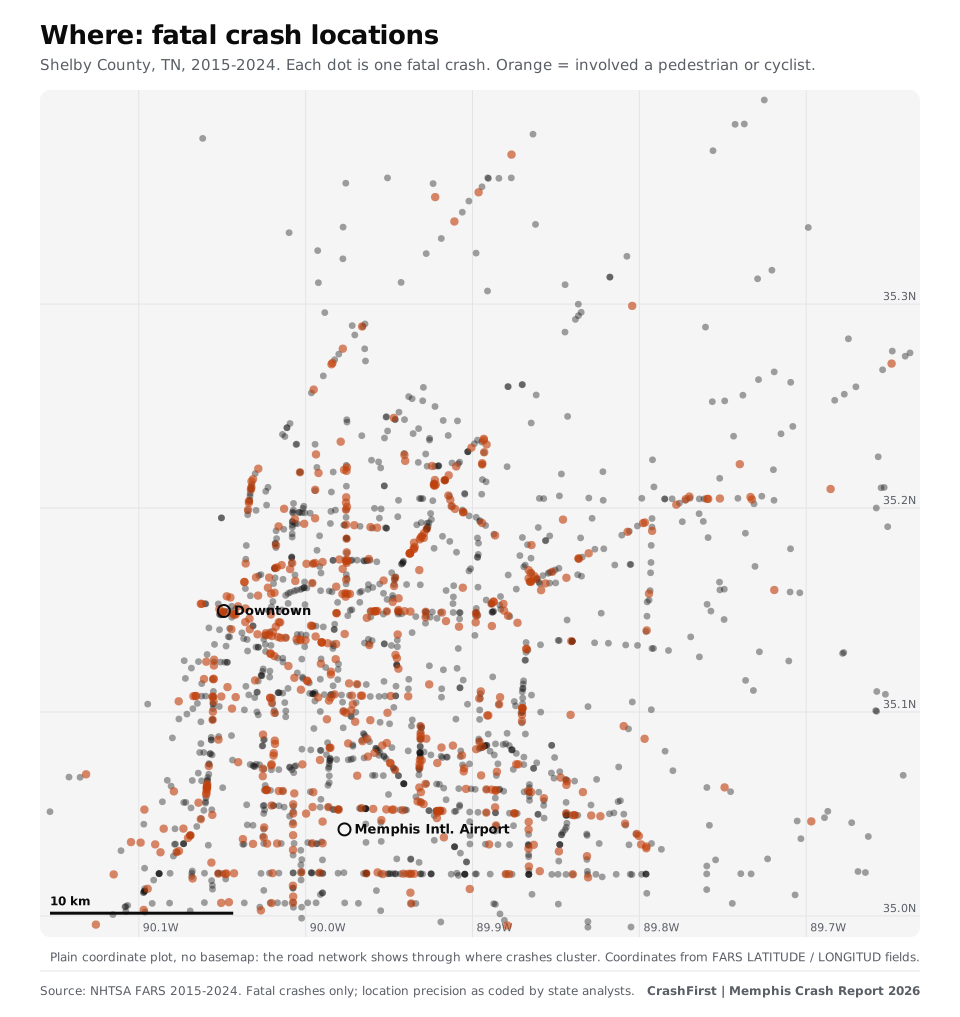
Dense lines of dots are roads where people have died repeatedly. Orange dots involve a person on foot or on a bicycle, and follow the city's arterial streets.
When: nights and weekends
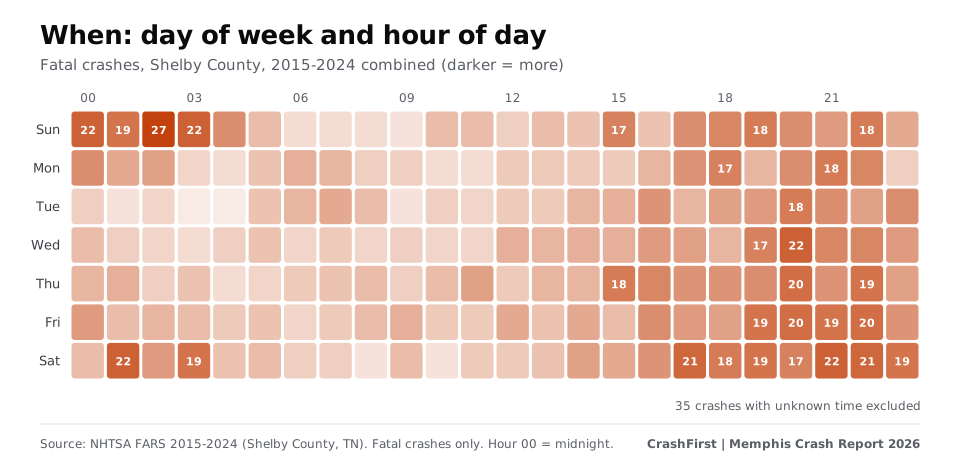
- Time of day: 44% of fatal crashes with a known time happened between 8 p.m. and 4 a.m.
- Day of week: 49% fell on a Friday, Saturday or Sunday; if crashes were spread evenly across the week, three days would be 43%.
- Busiest slot: Sunday at 2 a.m., with 27 fatal crashes over ten years (late Saturday night spills into Sunday).
- Month: October had the most (166 over ten years); January and February the fewest (117 and 119).
- Darkness: 58% happened in the dark, and most of those (844 crashes) on roads that had street lighting.
Who: pedestrians and people on motorcycles
| Road user | People killed, 2015 to 2024 |
|---|---|
| Drivers | 874 |
| Pedestrians | 487 |
| Passengers | 333 |
| Motorcyclists (rider or passenger) | 180 |
| Cyclists | 21 |
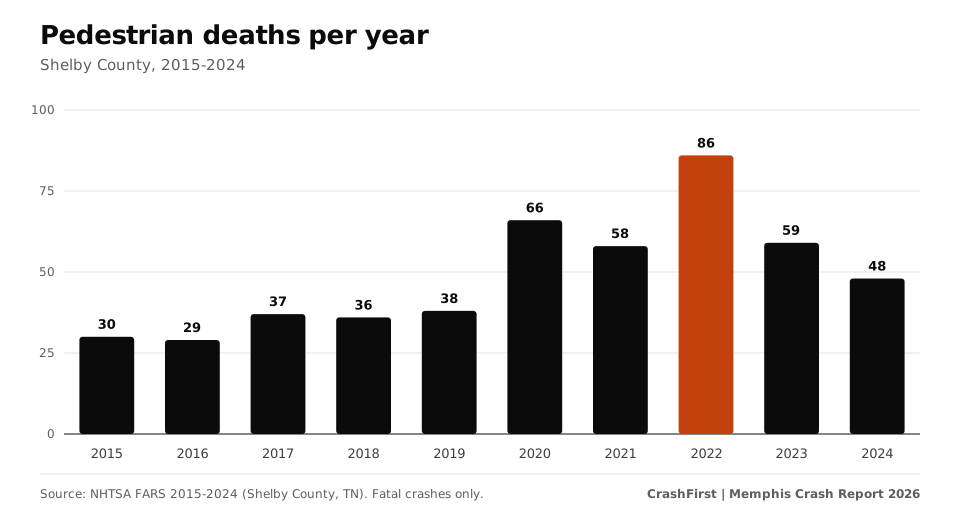
One in four people killed was on foot (26%). Pedestrian deaths peaked at 86 in 2022, and 80% of fatal crashes involving a pedestrian happened in the dark.
How Shelby County compares
In 2024, Shelby County recorded 23.4 traffic deaths per 100,000 residents, compared with 17.3 for Tennessee and 11.8 for the United States (Memphis city alone: 29.7). The county holds 13.5% of Tennessee's residents but had 18.2% of the state's 2024 traffic deaths. Annual deaths were between 120 and 158 from 2015 to 2019, then 246 to 259 in 2020 to 2023, and 218 in 2024.
Tennessee's TITAN system, which counts every police-reported crash, recorded 30,491 crashes in Shelby County in 2024, including 7,648 injury crashes [2]. Shelby ranked #1 of 95 counties for overall crash rate in 2021 to 2023 and #2 for injury crash rate in every year from 2021 to 2025 [2] [2].
What the data does and does not say
- A crash being on a road says something about exposure (traffic, speed, design). It does not say who was at fault.
- FARS counts only crashes in which someone died. Most crashes are not fatal.
- 2025 TITAN figures are partial (data available at the February 2026 publication date).
If you were hurt on one of these roads
Keep records of where and when it happened, the report number, photos, witnesses and your treatment. See what to do after a car accident in Memphis, how to get your crash report, and the free after-a-crash checklist.
Download the data
Corridor table (CSV) | Full Memphis Crash Report 2026 | Methodology
Cite as: "CrashFirst Memphis Crash Report 2026, based on NHTSA FARS and Tennessee TITAN data."
Sources
- NHTSA: fatality-analysis-reporting-system-fars
- Tennessee Highway Safety Office (TITAN): crash_rankings_2021-2025.pdf (checked November 8, 2026)Where: Crashes by severity, Shelby County row, 2024 (fatal, injury, property damage only, total)Where: Crash rates by type, Shelby County row: overall and injury crash rate ranks, 2021-2023Where: Crash rates by type, Shelby County row: overall and injury crash rate ranks, 2024-2025
- Tennessee Highway Safety Office (TITAN), Traffic Fatalities in Shelby County 2019-2021 (PDF)
- www.census.gov: 2020-census-results.html
Page last updated November 8, 2026. Attorney review pending. General information, not legal advice. Fees, hours and rules change; confirm on the official page. How we source.
Questions
What is the most dangerous road in Memphis?
By fatal crashes from 2015 to 2024, I-240 (95), I-40 (91) and Shelby Drive (87). Since 2020, Shelby Drive and I-240 are tied at 56.
Are Memphis crashes mostly on highways?
No. 73% of fatal crashes were on city arterial streets; 15% on interstates and freeways.
When do most fatal crashes happen in Memphis?
Late evening and overnight: 44% of fatal crashes with a known time happened between 8 p.m. and 4 a.m. Weekends carry more than an even share: 49% fell on a Friday, Saturday or Sunday.
How many pedestrians die in Memphis crashes?
487 people on foot died in Shelby County fatal crashes from 2015 to 2024 (26% of deaths).
Where does the data come from?
NHTSA's Fatality Analysis Reporting System and Tennessee's TITAN system; see the methodology section of the full report.
The state rules
Deadlines, fault and reports for all of Tennessee are in the Tennessee reference.
Keep reading
- Report
The Memphis Crash Report 2026.
Where, when and to whom serious crashes happen in Memphis and Shelby County, from NHTSA FARS (2015-2024) and Tennessee TITAN (2021-2025) data. Charts and CSVs.
Open - City guide
How to get a Memphis police crash report
Who wrote your Memphis crash report, how to request it online or in person, what it costs and how long it takes. Official links, checked Nov 2026.
Open - Free download
Your first-hour checklist, ready to print.
A one-page printable first-hour checklist for after a crash: safety, police, photos, doctor, insurer. Free PDF, no sign-up.
Open