
Home / Reports / The Memphis Crash Report 2026
The Memphis Crash Report 2026.
Where, when and to whom serious crashes happen in Memphis and Shelby County, Tennessee. Built from public federal and state crash records, 2015-2024, with Tennessee's own figures through 2025.
Free, and no is a fine answer.
- Not a law firm
- You never pay us
- No pressure
- Delete your info anytime
Key findings
- 1,909 people died in 1,755 fatal crashes in Shelby County from 2015 to 2024 (NHTSA FARS). 89% of those crashes carry the City of Memphis location code.
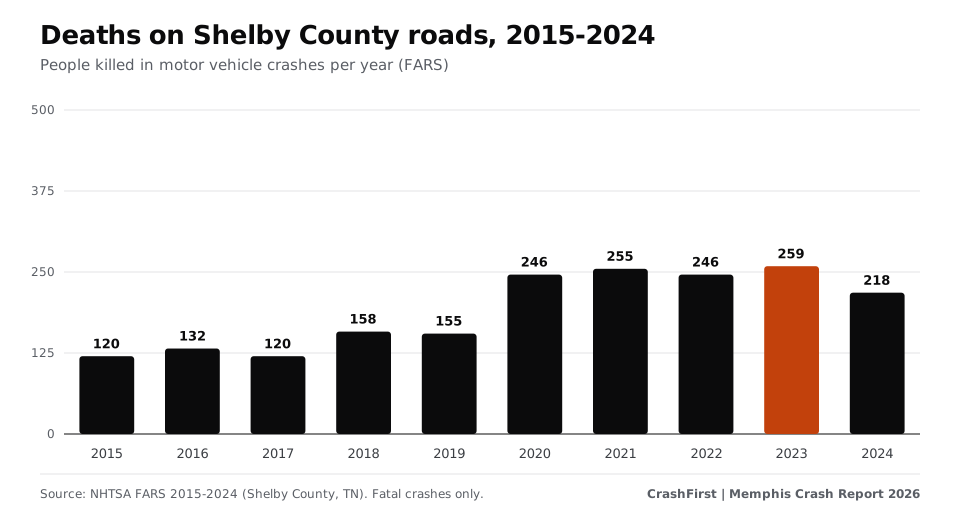
- Deaths more than doubled from 2015 to 2023. 120 deaths in 2015, 155 in 2019, then 246 in 2020 (+59% in a single year). The peak was 259 in 2023. 2024 fell to 218 (-16% vs 2023) but is still 41% above 2019.
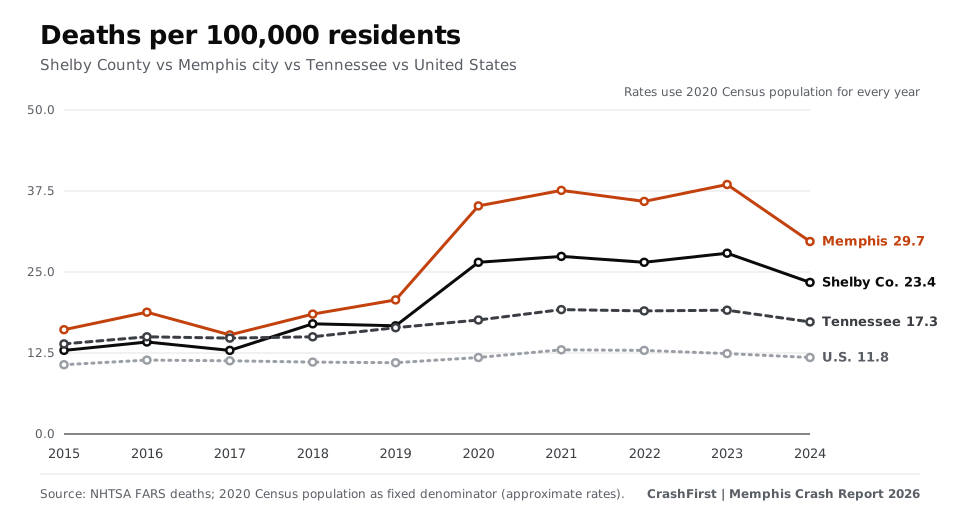
- Shelby County's death rate is about twice the national rate. 23.4 deaths per 100,000 residents in 2024 versus 17.3 for Tennessee and 11.8 for the U.S. (Memphis city alone: 29.7). The county holds 13.5% of Tennessee's residents but had 18.2% of the state's 2024 traffic deaths.
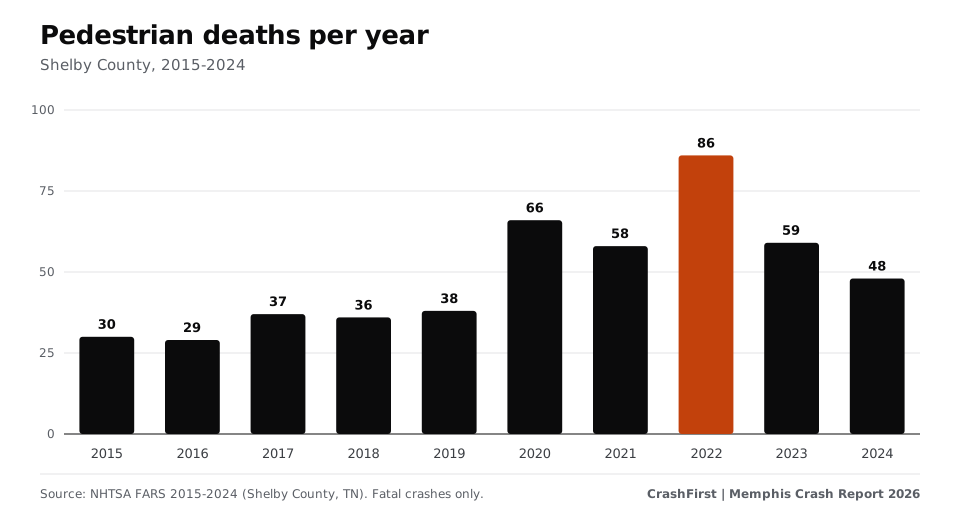
- One in four people killed was on foot. 487 pedestrians died (26% of all deaths), peaking at 86 in 2022. 80% of fatal crashes involving a pedestrian happened in the dark.
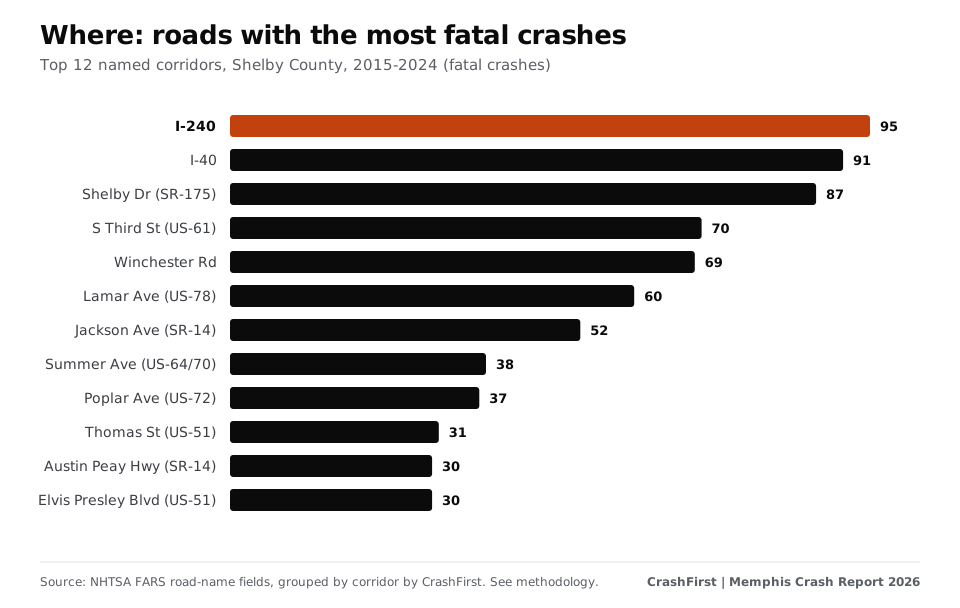
- Most fatal crashes happen on city arterials, not highways. 73% occurred on principal or minor arterial streets; 15% on interstates and freeways. The three deadliest corridors by crash count are I-240 (95), I-40 (91) and Shelby Dr (SR-175) (87).
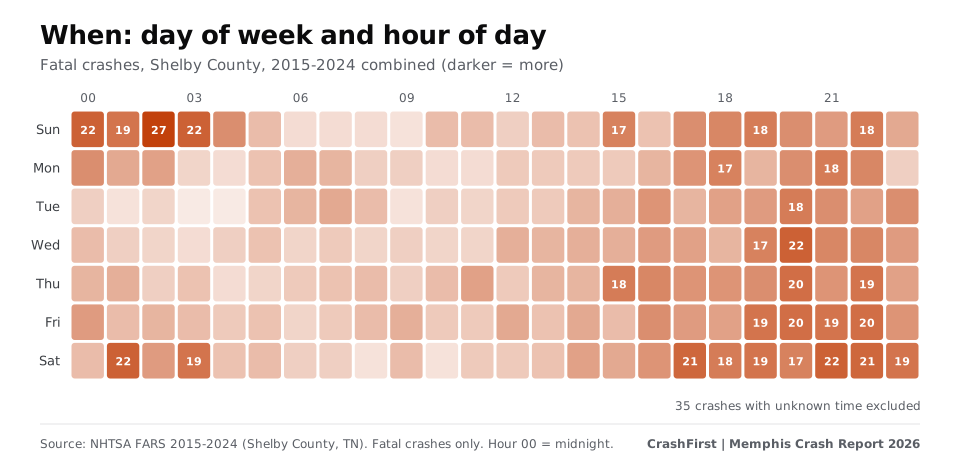
- Nights and weekends. 44% of fatal crashes with a known time happened between 8 p.m. and 4 a.m.; 49% fell on a Friday, Saturday or Sunday (three days would be 43% if evenly spread). The single busiest slot was Sun at 02:00 (27 fatal crashes over ten years; Saturday night spills into Sunday).
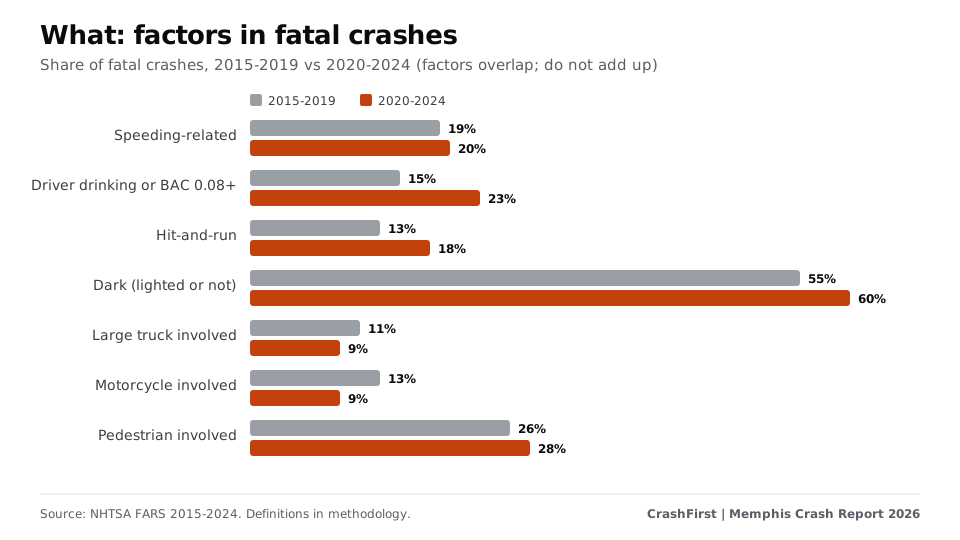
- Hit-and-run is rising. Fatal crashes where a driver fled went from 10 in 2015 to 45 at the peak and 31 in 2024; 13% of fatal crashes in 2015-2019 versus 18% in 2020-2024.
- State records show the wider picture. Tennessee's TITAN system counted 30,491 police-reported crashes in Shelby County in 2024, including 7,648 injury crashes. Shelby ranked #1 of 95 counties for overall crash rate in 2021-2023 and #2 for injury crash rate every year 2021-2025.
- Full report (PDF) Charts, method and sourcesPDF
- One-page summary (PDF) Press-readyPDF
- Deaths and crashes by yearCSV
- Fatal crashes by corridorCSV
- Tennessee TITAN county figuresCSV
- Every Shelby County fatal crash (FARS)CSV
- Every person involved (FARS)CSV
- Tennessee and U.S. totalsCSV
Quote with attribution: “CrashFirst Memphis Crash Report 2026, based on NHTSA FARS and Tennessee TITAN data.”
How much worse is it, and since when?
From 2015 to 2019 Shelby County recorded between 120 and 158 traffic deaths a year. In 2020 the count jumped to 246 [3]. It stayed between 246 and 259 through 2023. 2024 (218) is the first clear improvement, but the county is still well above its pre-2020 level. Across the five years 2015-2019 there were 685 deaths; across 2020-2024 there were 1,224.
The rise is not only a Memphis story: the whole country saw more deaths after 2019 (U.S. 36,355 to 43,230 by 2021) and Tennessee rose too (1,136 to 1,327). But Shelby County's increase was steeper: 16.7 to 27.4 deaths per 100,000 residents between 2019 and 2021, against 11.0 to 13.0 nationally.
Where: the corridors
FARS records the road name and coordinates of every fatal crash. Grouping the 1,755 crashes by named corridor, 23% fall on just five roads. Since 2020, the top corridors by fatal crashes are: Shelby Dr (SR-175) (56); I-240 (56); I-40 (50); S Third St (US-61) (48); Winchester Rd (44); Jackson Ave (SR-14) (33).
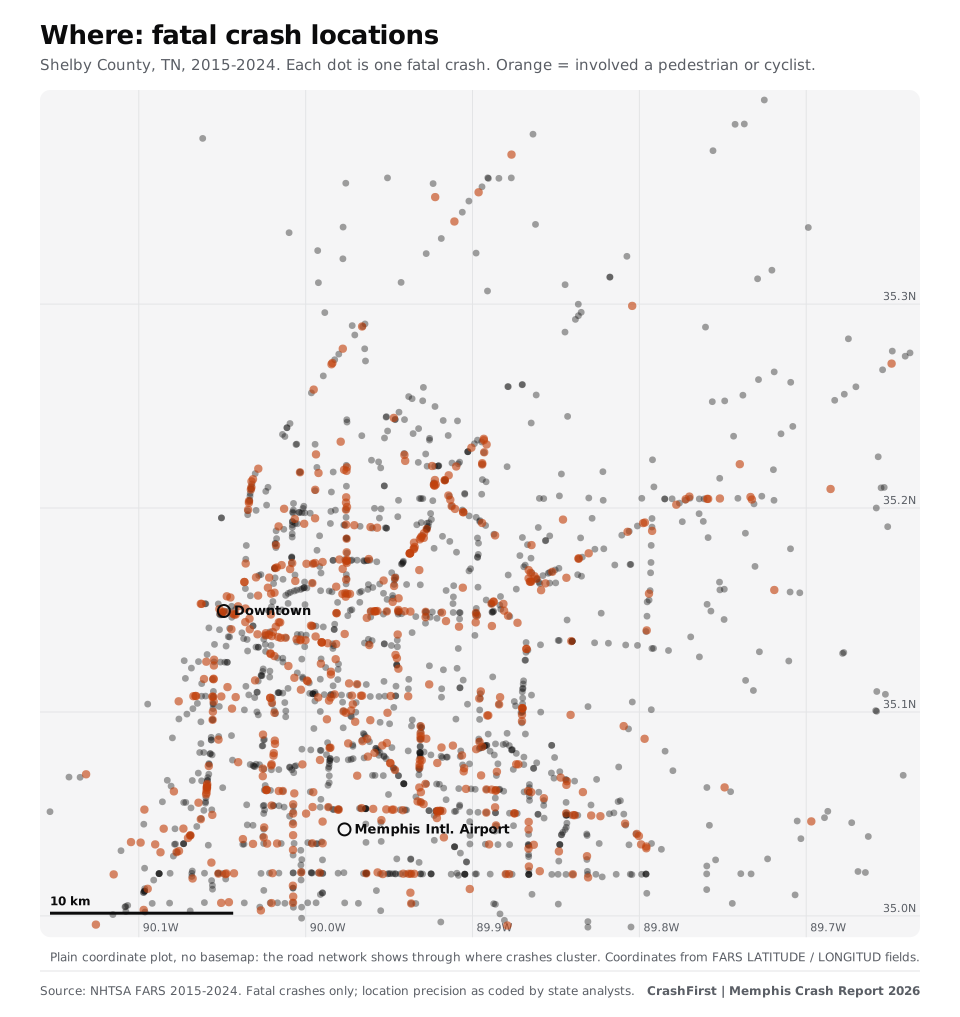
Reading the map: dense lines of dots are roads where people have died repeatedly. Orange dots involve a pedestrian or cyclist and follow the city's arterial streets. A crash being on a road says something about exposure (traffic volume, speed, design); it does not say who was at fault.
When: months, days, hours
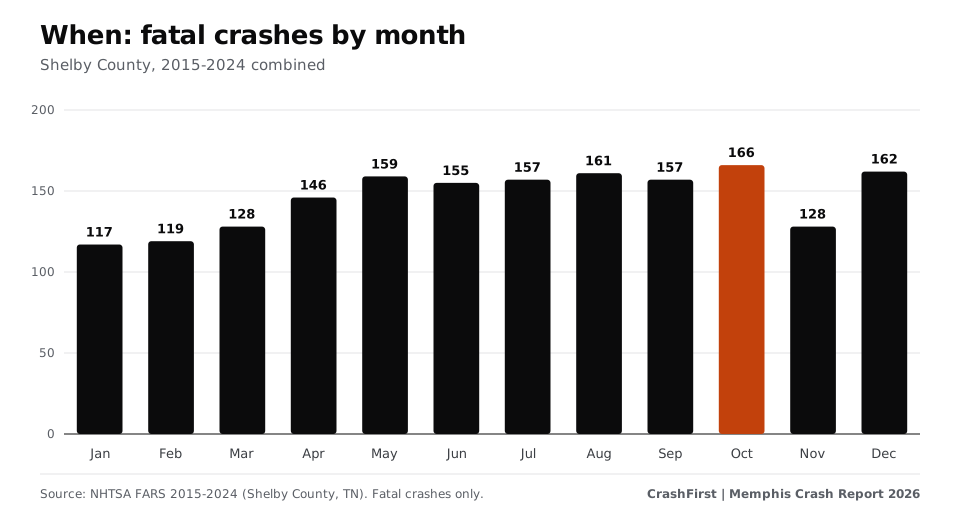
Fatal crashes are spread across the year, with Oct the highest month (166 over ten years) and January-February the lowest (117 and 119). The pattern by hour matters more: late evening and overnight, especially on weekends.
Who: people on foot, motorcyclists, drivers
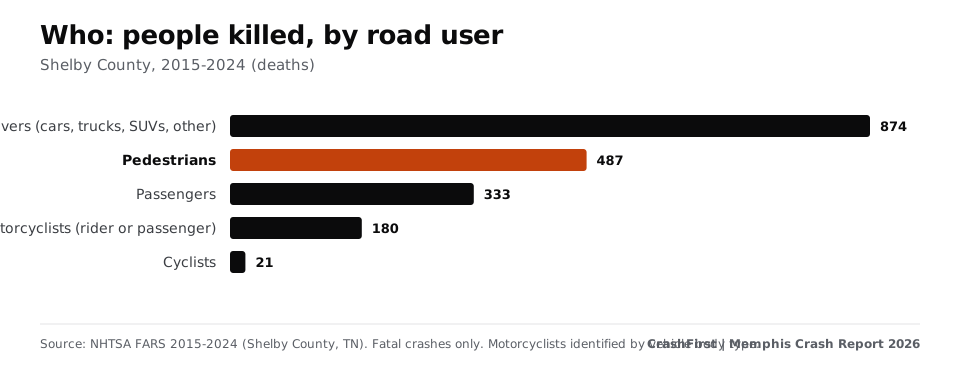
Deaths by road-user type, 2015-2024: drivers (cars, trucks, suvs, other): 874, pedestrians: 487, passengers: 333, motorcyclists (rider or passenger): 180, cyclists: 21. People aged 25-34 were the largest age group among those killed (423), followed by 15-24 (351) and 35-44 (316). 72 children under 15 died.
What was involved
FARS flags contributing circumstances. Over 2015-2024, 339 fatal crashes (19%) were speeding-related, 353 (20%) involved a driver who was drinking or tested at 0.08 or above, 283 (16%) were hit-and-run, 166 (9%) involved a large truck and 181 (10%) a motorcycle. 58% happened in the dark; most of those (844 crashes) on roads that had street lighting. These flags overlap and describe the crash, not who caused it.
Tennessee state records (all police-reported crashes)
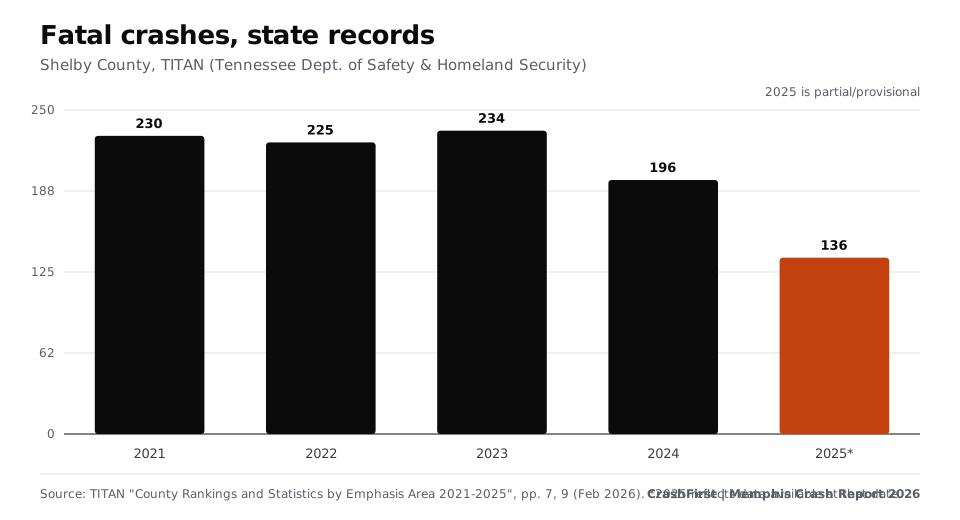
FARS only counts crashes where someone died. Tennessee's TITAN system (Department of Safety & Homeland Security) counts every police-reported crash. For Shelby County:
| Year | Fatal crashes | Injury crashes | All crashes | Fatal crash rate* | Tennessee rate* |
|---|---|---|---|---|---|
| 2021 | 230 | 9,070 | 38,251 [2] | 0.368 | 0.231 |
| 2022 | 225 | 8,465 | 34,888 [2] | 0.353 | 0.221 |
| 2023 | 234 | 8,617 | 33,017 [2] | 0.353 | 0.211 |
| 2024 | 196 | 7,648 | 30,491 [2] | 0.301 | 0.190 |
| 2025** | 136 | 6,762 | 27,197 [2] | 0.212 | 0.167 |
*Fatal crashes per 1,000 licensed drivers, as published by TITAN. **2025 reflects data available at the February 2026 publication date and is not comparable to full years. Tennessee statewide fatal crashes: 2021: 1,229, 2022: 1,214, 2023: 1,219, 2024: 1,097, 2025: 971.
Shelby County's fatal crash rate per licensed driver is higher than the state's every year (0.301 vs 0.19 in 2024), and its injury crash rate was 11.76 per 1,000 licensed drivers in 2024 against 7.705 statewide [2] [2]. TITAN's alcohol-impaired-driving fatalities in Shelby County were 72, 64, 65, 49 for 2021-2024, with 22 recorded so far for 2025 (partial) [2] [2]. TITAN and FARS use different definitions, so their alcohol figures differ.
What this means for people on Memphis roads
- Most fatal crashes happen on ordinary city arterials people use daily, and most after dark. Corridors, not just highways, matter.
- People walking account for about one in four deaths (26%), and most of those crashes happen after dark.
- If you are hurt in a crash, keep records: where and when it happened, the police report number, photos, names of witnesses, your treatment and bills. See our free printable checklist and journal.
Methodology
- Fatal crash data: NHTSA Fatality Analysis Reporting System (FARS) annual national CSV files for 2015-2024, downloaded from https://www.nhtsa.gov/research-data/fatality-analysis-reporting-system-fars. These are the files NHTSA publishes on that site; 2024 is the latest year available as of 2026-11-08, and NHTSA may revise recent years. We kept records with STATE=47 (Tennessee) and COUNTY=157 (Shelby).
- Memphis vs county: crashes with FARS city code 1620 (Memphis) are labelled Memphis; all other Shelby County crashes (Germantown, Collierville, Bartlett, Millington, Arlington, Lakeland, unincorporated) are 'other'. Code 1620 appears on 89% of Shelby County records.
- Rates: deaths divided by 2020 Census resident population (Memphis 633,104; Shelby County 929,744; Tennessee 6,910,840; U.S. 331,449,281) and multiplied by 100,000. A single census base is used for every year, so rates are approximate; true per-year population would move the numbers a few percent.
- Corridors: FARS TWAY_ID (primary road name) grouped by us to combine variants (for example SR-175 SHELBY DR and SR-175 E SHELBY DR). Only the primary road is counted. Corridors are counts of fatal crashes, not risk per mile or per vehicle.
- Road user: FARS PER_TYP; motorcyclists identified from vehicle body type 80-89. 'Alcohol' means a driver with police-reported drinking or a test result of 0.08+; 'speeding' means FARS marks any vehicle as speed-related; 'dark' includes lighted and unlighted roads. Hour 'unknown' crashes are excluded from time-of-day charts.
- Tennessee data: TITAN, 'Tennessee Traffic Crash Data: County Rankings and Statistics by Emphasis Area 2021-2025', TITAN Business Unit, February 2026 (revised 2/12/2026), https://www.tntrafficsafety.org/sites/default/files/crash_rankings_2021-2025.pdf; figures transcribed from the published tables for Shelby County [2]. TN's interactive TITAN dashboards were not used.
- Not counted: crashes where nobody died (except in the TITAN section), unreported crashes, and anything after FARS's latest year. Fatal totals can differ slightly between FARS and TITAN because of reporting timing and definitions.
- Reproduce it: the cleaned CSVs are downloadable on this page. Raw NHTSA files are the public FARS downloads linked in Sources; code is Python 3 using only the standard library, charts are plain SVG.
Important notice
CrashFirst is not a law firm and does not give legal advice. This report is general, factual information drawn from public records. It does not say who is at fault in any crash and is not a substitute for advice from a licensed attorney. Crash figures are counts of recorded events, not predictions about any person's safety or claim.
Data can be quoted with attribution: 'CrashFirst Memphis Crash Report 2026, based on NHTSA FARS and Tennessee TITAN data.' Corrections: tell us and we will update the report.
Keep reading
- Guide
What to do after a crash.
A calm, ordered checklist for the scene, today, the next 72 hours and the next few weeks. Tick it off here or print it for the glove box.
Open - Free download
Your first-hour checklist, ready to print.
A one-page printable first-hour checklist for after a crash: safety, police, photos, doctor, insurer. Free PDF, no sign-up.
Open - Free download
One place for what happened, what it cost, and who you talked to.
An 8-page printable organizer for crash details, symptoms, medical visits, bills, missed work and insurer calls. Free PDF, no sign-up.
Open
Sources
- NHTSA, Fatality Analysis Reporting System (FARS), 2015-2024 national CSV files
- Tennessee Department of Safety & Homeland Security, TITAN Business Unit. Tennessee Traffic Crash Data, County Rankings and Statistics by Emphasis Area 2021-2025 (Feb 2026) (checked November 8, 2026)Where: Crashes by severity, Shelby County row, 2021 (fatal, injury, property damage only, total)Where: Crashes by severity, Shelby County row, 2022Where: Crashes by severity, Shelby County row, 2023Where: Crashes by severity, Shelby County row, 2024Where: Crashes by severity, Shelby County row, 2025 (partial year)Where: Crash rates by type, Shelby County row (fatal and injury crash rates per licensed driver)Where: Crash rates by type, statewide total row (fatal and injury crash rates per licensed driver)Where: Alcohol-impaired driving fatalities, Shelby County row, 2021-2023Where: Alcohol-impaired driving fatalities, Shelby County row, 2024 and 2025 (partial)“County Rankings and Statistics by Emphasis Area 2021 - 2025 TITAN Business Unit February 2026 Revised 2/12/2026”
- TITAN, Traffic Fatalities in Shelby County 2019-2021 (one-page summary) (checked November 8, 2026)Where: Shelby County fatalities 2019-2021, total fatalities row
- U.S. Census Bureau, 2020 Census resident population counts
Page last updated November 8, 2026. Attorney review pending. General information, not legal advice. Fees, hours and rules change; confirm on the official page. How we source.