
Data: NHTSA Fatality Analysis Reporting System (FARS), 2015 to 2024 [1]. Counts of fatal crashes, not risk per mile, and not a statement about who was at fault. Covers Richland and Lexington counties, the Columbia metro; 19% of the crashes carry the FARS city code for Columbia. Last updated November 9, 2026. Part of The Columbia, SC Crash Report 2026.
The corridors, ranked
FARS records the road name for each fatal crash as a route number (for example I-20 or US-1). The street name in the last column appears only where the FARS record itself carries it; many records show the route number alone, so the street names below describe some, not all, of each route's crashes.
| Rank | Road (route) | Fatal crashes, 2015 to 2024 | People killed | Fatal crashes, 2020 to 2024 | Street name in some FARS records |
|---|---|---|---|---|---|
| 1 | I-20 | 78 | 85 | 35 | none |
| 2 | US-1 | 72 | 81 | 37 | Two Notch Rd (14 of 72 records) |
| 3 | I-26 | 65 | 73 | 30 | none |
| 4 | I-77 | 55 | 61 | 31 | none |
| 5 | US-76 | 52 | 52 | 24 | Garners Ferry Rd (8 of 52 records) |
| 6 | US-21 | 35 | 37 | 20 | Charleston Hwy (6 of 35 records) |
| 7 | SR-6 | 32 | 34 | 16 | none in 6 or more records |
| 8 | US-321 | 28 | 29 | 16 | none in 6 or more records |
| 9 | SR-48 | 27 | 29 | 14 | Bluff Rd (8 of 27 records) |
| 10 | SR-555 | 25 | 27 | 15 | Farrow Rd (13 of 25 records) |
| 11 | US-378 | 25 | 29 | 10 | none in 6 or more records |
| 12 | US-176 | 23 | 23 | 16 | Broad River Rd (7 of 23 records) |
| 13 | SR-302 | 21 | 22 | 11 | none in 6 or more records |
| 14 | SR-12 | 19 | 20 | 11 | Percival Rd (6 of 19 records) |
| 15 | US-178 | 17 | 17 | 8 | none in 6 or more records |
How to read it: a "corridor" is one numbered route, with name variants combined. Counts are the primary road recorded for each fatal crash. Roads with more traffic, more miles or more intersections will have more crashes; this table does not correct for that [2]. Since 2020, US-1 (37), I-20 (35) and I-77 (31) have the most fatal crashes.
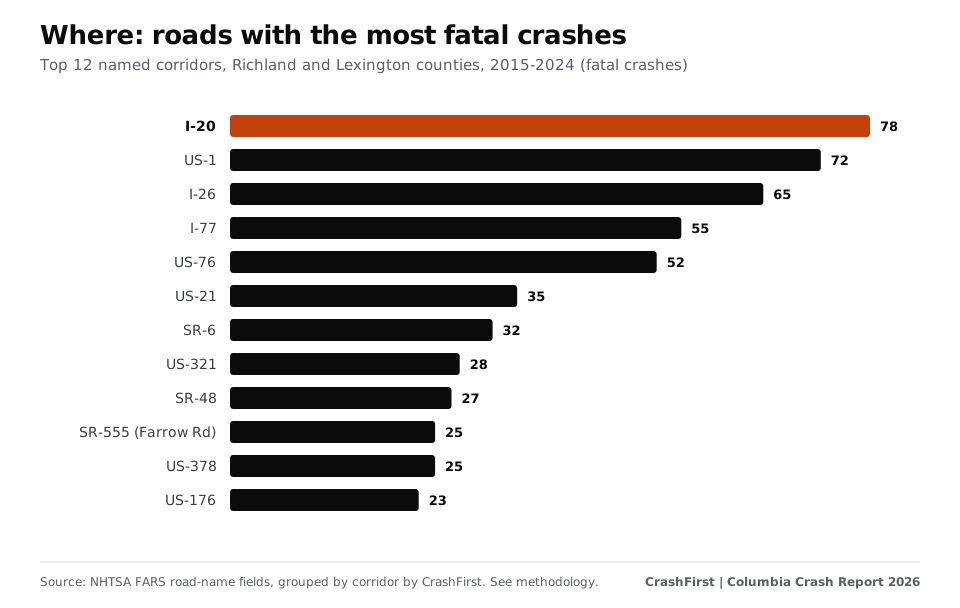
The top five roads account for 32% of all fatal crashes in the two counties.
Map
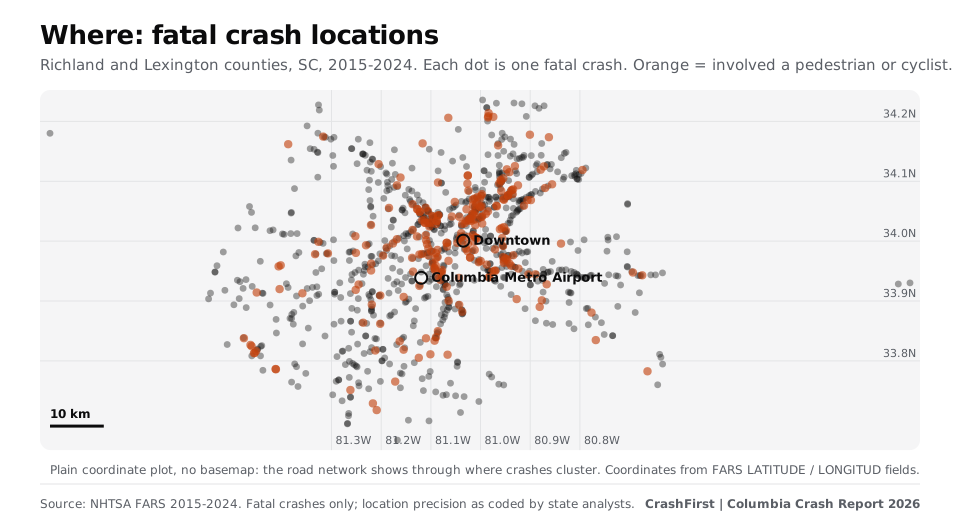
Dense lines of dots are roads where people have died repeatedly. Orange dots involve a person on foot or on a bicycle.
When: nights and weekends
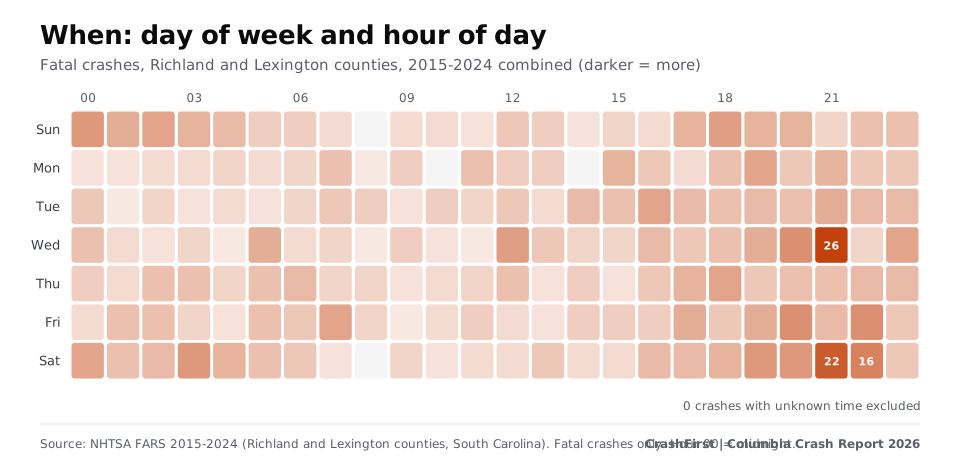
- Time of day: 43% of fatal crashes happened between 8 p.m. and 4 a.m.
- Day of week: 47% fell on a Friday, Saturday or Sunday; if crashes were spread evenly across the week, three days would be 43%.
- Busiest slot: Wednesday at 9 p.m., with 26 fatal crashes over ten years.
- Month: June had the most (98 over ten years); February the fewest (65).
- Darkness: 57% happened in the dark, and 376 crashes (37% of all fatal crashes) were on roads FARS records as dark and not lighted.
Who: pedestrians and people on motorcycles
| Road user | People killed, 2015 to 2024 |
|---|---|
| Drivers | 526 |
| Pedestrians | 224 |
| Motorcyclists (rider or passenger) | 182 |
| Passengers | 132 |
| Cyclists | 19 |
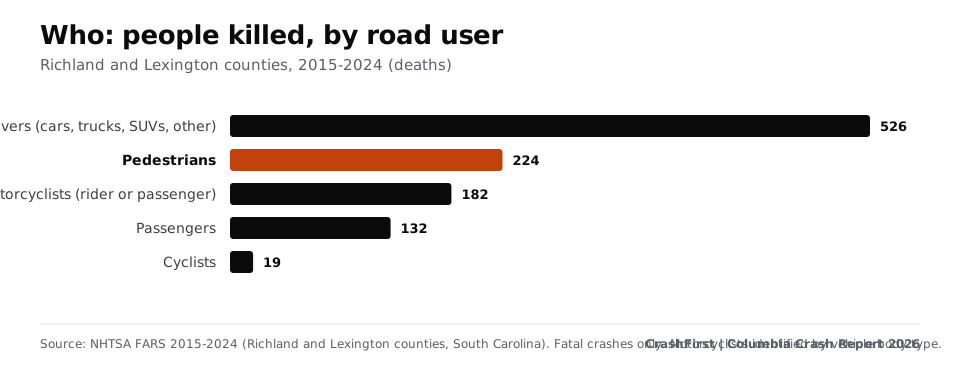
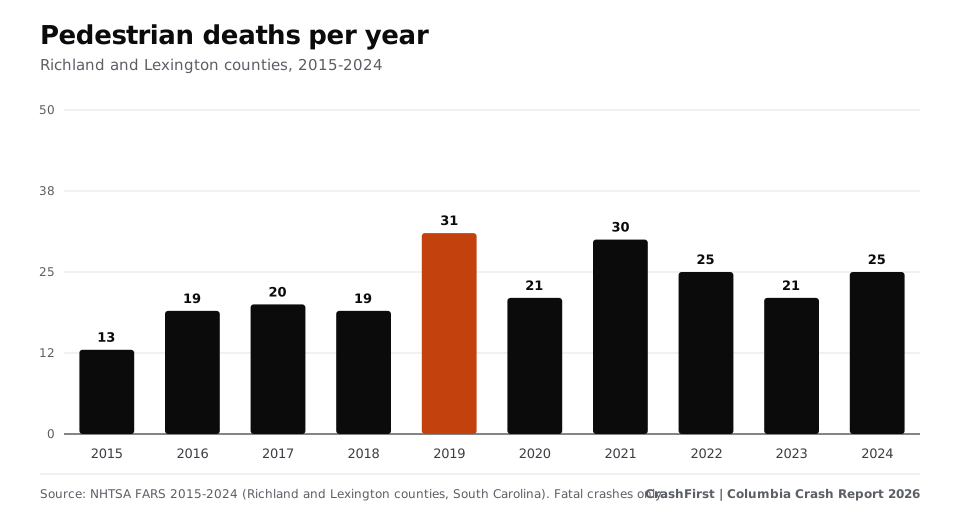
One in five people killed was on foot (21%). Pedestrian deaths peaked at 31 in 2019, and 86% of fatal crashes involving a pedestrian happened in the dark. Motorcyclists accounted for 182 deaths. Fatal hit-and-run crashes went from 2 in 2015 to 7 in 2024 (peak 9 in 2021 and 2022).
How the Columbia area compares
In 2024, Richland and Lexington counties recorded 16.5 traffic deaths per 100,000 residents, compared with 20.3 for South Carolina and 11.8 for the United States (Columbia city alone: 21.2). The two counties hold 13.9% of South Carolina's residents and had 11.3% of the state's 2024 traffic deaths. Annual deaths were between 91 and 131 from 2015 to 2024, peaking at 131 in 2021, and 117 in 2024. Rates divide deaths by a fixed April 2020 population base, so they are approximate [3].
This edition uses FARS, which counts only fatal crashes. Counts of all police-reported crashes from South Carolina's state records were not used.
What the data does and does not say
- A crash being on a road says something about exposure (traffic, speed, design). It does not say who was at fault.
- FARS counts only crashes in which someone died. Most crashes are not fatal.
- Street names come only from the FARS record; they are shown where at least six records carry the same name, and the table says how many.
If you were hurt on one of these roads
Keep records of where and when it happened, the report number, photos, witnesses and your treatment. See what to do after a car accident in Columbia, how to get your crash report, and the free after-a-crash checklist.
Download the data
Corridor table (CSV) | Full Columbia, SC Crash Report 2026 | Methodology
Cite as: "CrashFirst Columbia Crash Report 2026, based on NHTSA FARS data."
Sources
- NHTSA, Fatality Analysis Reporting System (FARS) (checked November 9, 2026)Where: FARS data documentation and annual file downloads, 2015-2024
- NHTSA FARS annual national CSV file downloads, 2015-2024 (checked November 9, 2026)Where: FARS annual national CSV files 2015-2024, South Carolina (STATE 45), Richland and Lexington counties, primary road (TWAY_ID), grouped by CrashFirst
- U.S. Census Bureau, Vintage 2024 population estimates, 2020-2024 datasets (April 2020 base) (checked November 9, 2026)Where: Vintage 2024 population estimates (April 1, 2020 base): Richland and Lexington counties, South Carolina; South Carolina; United States
Page last updated November 9, 2026. Attorney review pending. General information, not legal advice. Fees, hours and rules change; confirm on the official page. How we source.
Questions
What is the most dangerous road in Columbia, SC?
By fatal crashes from 2015 to 2024 in Richland and Lexington counties, I-20 (78), US-1 (72) and I-26 (65). Since 2020, US-1 leads with 37. These are counts, not risk per mile.
Are Columbia crashes mostly on highways?
No. 58% of fatal crashes were on arterial streets; 22% on interstates and freeways.
When do most fatal crashes happen in Columbia?
Late evening and overnight, especially on weekends: 43% between 8 p.m. and 4 a.m., and 47% on Friday through Sunday.
How many pedestrians die in Columbia-area crashes?
224 people on foot died in fatal crashes in Richland and Lexington counties from 2015 to 2024 (21% of deaths).
Where does the data come from?
NHTSA's Fatality Analysis Reporting System; see the methodology section of the full report. It counts only crashes in which someone died and does not say who was at fault.
The state rules
Deadlines, fault and reports for all of South Carolina are in the South Carolina reference.
Keep reading
- Report
The Columbia, SC Crash Report 2026.
Where, when and to whom serious crashes happen in Columbia and the Richland and Lexington county area, South Carolina, from NHTSA FARS data, 2015-2024. Charts and CSVs.
Open - City guide
How to get a Columbia, SC police crash report
How to get a Columbia, South Carolina police or Highway Patrol crash report: CPD Records ($3.00), SCDMV online, branch or mail (FR-50). Checked Nov 2026.
Open - City guide
What to do after a car accident in Columbia, SC
Columbia, South Carolina car accident steps: who to call, how to get your crash report, local hospitals and South Carolina rules on deadlines and reporting.
Open - State reference
South Carolina statute of limitations for car accident injury claims
South Carolina gives three years for most injury claims after a crash, counted from when you knew of the claim. Exact statute text, wrongful death and government claims.
Open - Free download
Your first-hour checklist, ready to print.
A one-page printable first-hour checklist for after a crash: safety, police, photos, doctor, insurer. Free PDF, no sign-up.
Open