
Data: NHTSA Fatality Analysis Reporting System (FARS), 2015 to 2024. Counts of fatal crashes, not risk per mile, and not a statement about who was at fault. Last updated November 9, 2026. Part of The Birmingham Crash Report 2026.
The corridors, ranked
| Rank | Road (as coded in FARS) | Fatal crashes, 2015 to 2024 | People killed | Fatal crashes, 2020 to 2024 |
|---|---|---|---|---|
| 1 | I-59 | 111 | 117 | 63 |
| 2 | I-65 | 69 | 73 | 40 |
| 3 | I-459 | 52 | 56 | 28 |
| 4 | SR-5 | 28 | 29 | 22 |
| 5 | US-31 / SR-3 | 25 | 26 | 10 |
| 6 | SR-79 | 23 | 23 | 12 |
| 7 | I-20 | 18 | 20 | 12 |
| 8 | I-22 | 13 | 14 | 8 |
| 9 | 1st Ave N | 12 | 12 | 4 |
| 10 | SR-75 | 10 | 10 | 3 |
| 11 | Bessemer Rd | 8 | 8 | 1 |
| 12 | SR-4 | 8 | 8 | 3 |
| 13 | SR-150 | 7 | 8 | 1 |
| 14 | 3rd Ave W | 7 | 7 | 5 |
| 15 | US-280 | 7 | 7 | 5 |
How to read it: a "corridor" is the primary road recorded for each fatal crash, with variants combined (for example I-59 with entries coded as an exit or ramp of I-59). Where FARS records only a route number we show only the number and do not assign a local street name. "US-31 / SR-3" combines the codes US-31 SR-3, SR-3 and US-SR 3. Roads with more traffic, more miles or more intersections will have more crashes; this table does not correct for that [2]. Interstates I-59 and I-20 share road in downtown Birmingham, and FARS codes some crashes under one or both numbers.
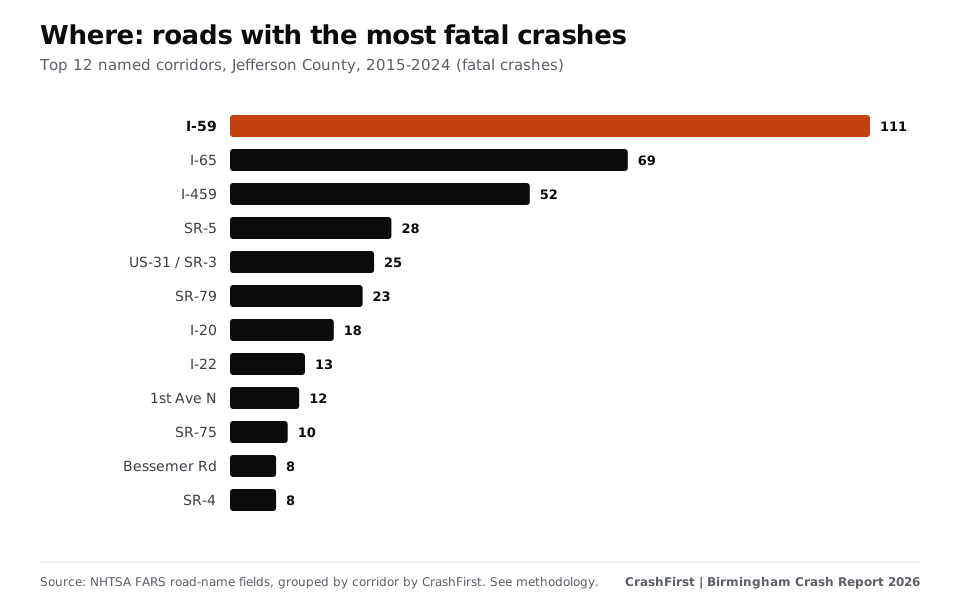
The top five roads account for 32% of all fatal crashes in the county.
Map
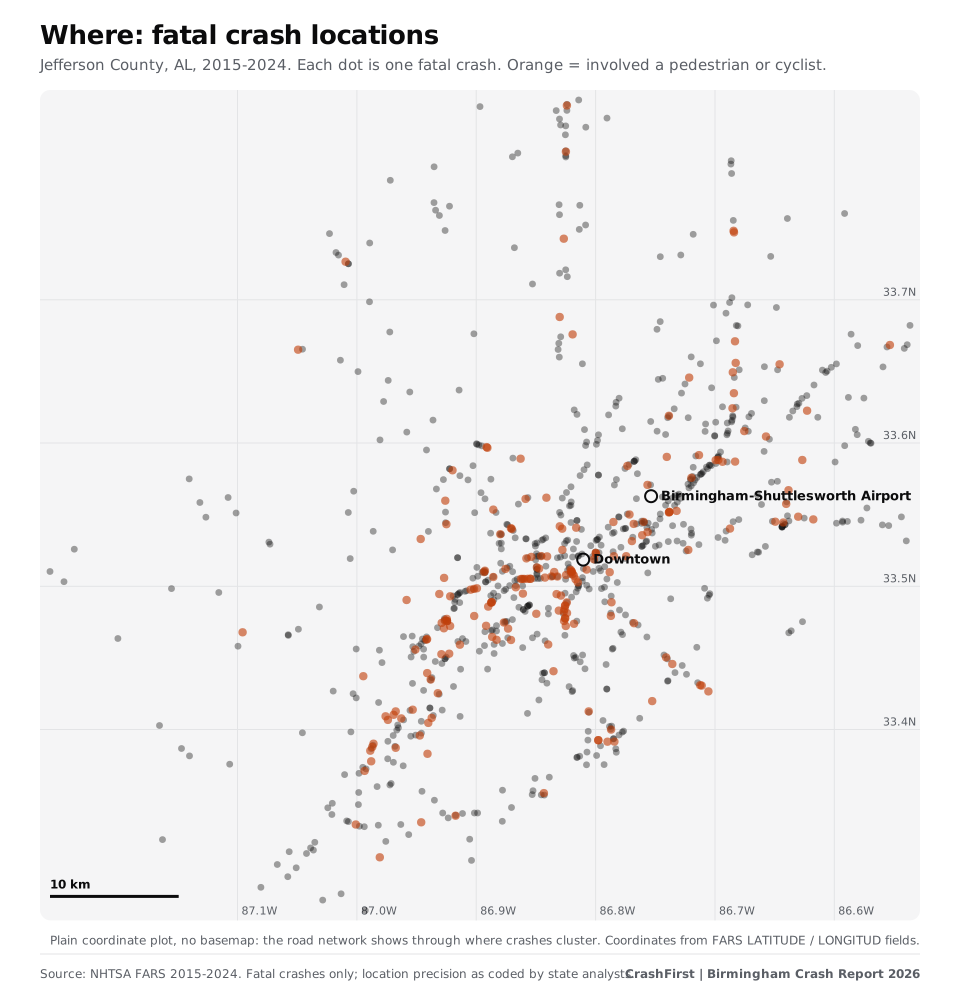
Dense lines of dots are roads where people have died repeatedly. Orange dots involve a person on foot or on a bicycle.
When: nights and weekends
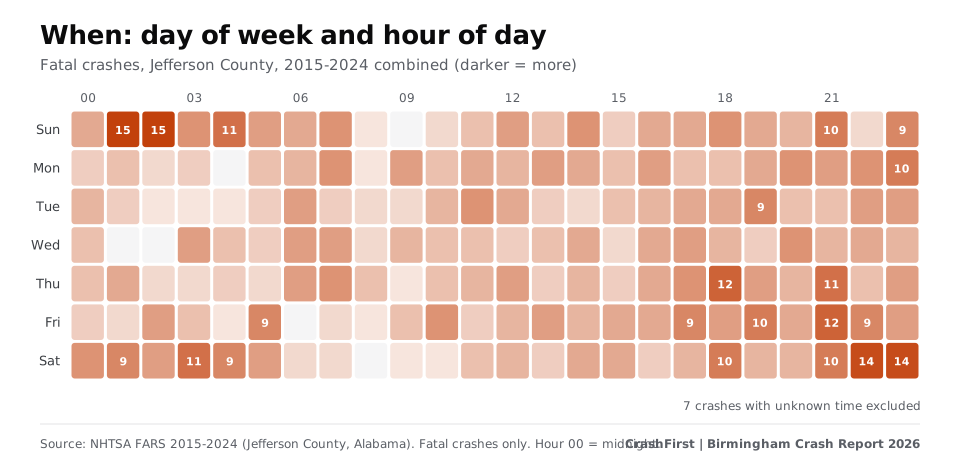
- Time of day: 39% of fatal crashes with a known time happened between 8 p.m. and 4 a.m.
- Day of week: 49% fell on a Friday, Saturday or Sunday; if crashes were spread evenly across the week, three days would be 43%.
- Busiest slot: Sunday at 2 a.m., with 15 fatal crashes over ten years (late Saturday night spills into Sunday).
- Month: July had the most (96 over ten years); June the fewest (58).
- Darkness: 54% happened in the dark: 265 crashes on lighted roads and 214 on roads with no lighting.
Who: pedestrians and people on motorcycles
| Road user | People killed, 2015 to 2024 |
|---|---|
| Drivers | 526 |
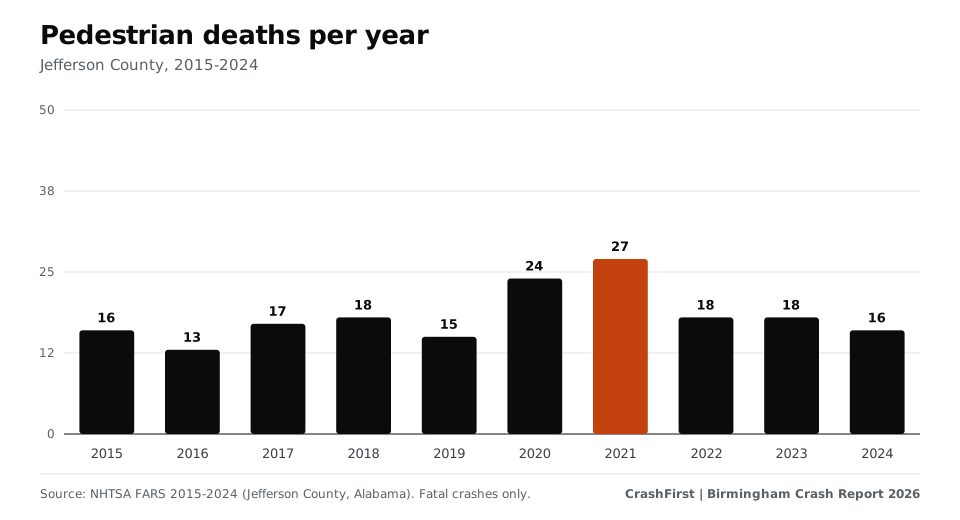
| Pedestrians | 182 |
| Passengers | 126 |
| Motorcyclists (rider or passenger) | 106 |
| Cyclists | 11 |
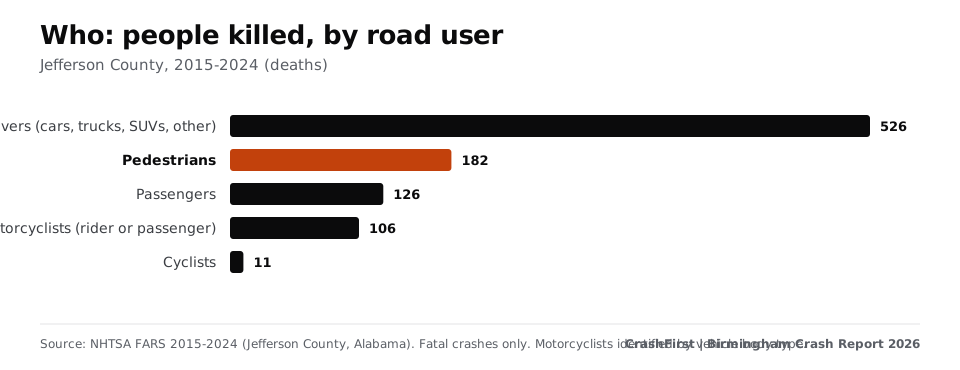
Pedestrians were 19% of the people killed. 82% of the fatal crashes that involved a pedestrian happened in the dark.
What was involved
Over 2015 to 2024, 163 fatal crashes (18%) were speeding-related, 101 (11%) involved a driver who was drinking or tested at 0.08 or above, 74 (8%) were hit-and-run, 91 (10%) involved a large truck and 108 (12%) a motorcycle. These flags overlap and describe the crash, not who caused it.
How Jefferson County compares
| Deaths per 100,000 residents, 2024 | Ten-year average | |
|---|---|---|
| Jefferson County | 15.0 | 14.2 |
| Alabama | 19.1 | 19.1 |
| United States | 11.8 | 11.7 |
Deaths per year in the county ranged from 80 (2015) to 112 (2023); 2024 had 101. Rates use a fixed April 2020 population base (Jefferson County 674,311; Alabama 5,025,369), so they are approximate [3]. The county's rate is lower than Alabama's overall and higher than the national rate.
If you were hurt in a crash
Keep the police report number, photos, names of witnesses and your medical records. See how to get a Birmingham crash report, the Alabama two-year deadline and what to do after a car accident in Birmingham.
Methodology and sources
NHTSA FARS annual national CSV files, 2015 to 2024 (https://static.nhtsa.gov/nhtsa/downloads/FARS/); Jefferson County, AL (state 1, county 73). Crashes carrying the FARS city code for Birmingham are 45% of the total; the rest are other cities and unincorporated Jefferson County. Population base: Census Bureau Vintage 2024 estimates, April 2020 base. Full methodology and charts are in the report; the corridor table is a free CSV (see below).
Download the data
Corridor table (CSV) | Full Birmingham Crash Report 2026 | Methodology
Cite as: "CrashFirst Birmingham Crash Report 2026, based on NHTSA FARS data."
Sources
- NHTSA, Fatality Analysis Reporting System (FARS)
- NHTSA FARS annual national CSV file downloads, 2015-2024 (checked November 9, 2026)Where: FARS annual national CSV files 2015-2024, STATE 01, COUNTY 073, primary road (TWAY_ID), grouped by CrashFirstWhere: FARS annual national CSV files 2015-2024, STATE 01, COUNTY 073, primary road (TWAY_ID), our grouping
- U.S. Census Bureau, Vintage 2024 population estimates, 2020-2024 datasets (April 2020 base) (checked November 9, 2026)Where: Vintage 2024 population estimates (April 1, 2020 base): Jefferson County, Alabama 674,311; Alabama 5,025,369
Page last updated November 9, 2026. Attorney review pending. General information, not legal advice. Fees, hours and rules change; confirm on the official page. How we source.
Questions
What is the most dangerous road in Birmingham?
By number of fatal crashes in Jefferson County, 2015 to 2024, I-59 had the most (111), then I-65 (69) and I-459 (52). These are counts, not risk per mile [2].
How many people die in car crashes in Birmingham each year?
In Jefferson County, 80 to 112 people a year from 2015 to 2024 (FARS). Fatal crashes carrying the City of Birmingham location code ran from 34 to 50 a year.
Are most fatal crashes on interstates and freeways?
No. 29% were on interstates and freeways and 45% on principal or minor arterial roads.
When do most fatal crashes happen?
At night and on weekends: 39% of those with a known time between 8 p.m. and 4 a.m., and 49% on a Friday, Saturday or Sunday.
Does this data say who was at fault?
No. It counts fatal crashes by road, time and road user. It does not say who caused any crash.
The state rules
Deadlines, fault and reports for all of Alabama are in the Alabama reference.
Keep reading
- Report
The Birmingham Crash Report 2026.
Where, when and to whom serious crashes happen in Birmingham and Jefferson County, Alabama, from NHTSA FARS data, 2015-2024. Charts and CSVs.
Open - City guide
Birmingham, AL police accident report: how to get yours
How to get a Birmingham, Alabama police or ALEA accident report: BPD Records Division, the ALEA portal, who can request one. Checked Nov 2026.
Open - City guide
What to do after a car accident in Birmingham, AL
Steps after a Birmingham, Alabama crash: who to call, Alabama reporting duties, how to get your report, and the deadlines and fault rule that affect timing.
Open - State reference
Alabama statute of limitations for car accident injury claims
Alabama gives two years for most car accident injury claims and two years for wrongful death. Exact statute text, exceptions and city-claim notice rules.
Open - Free download
Your first-hour checklist, ready to print.
A one-page printable first-hour checklist for after a crash: safety, police, photos, doctor, insurer. Free PDF, no sign-up.
Open